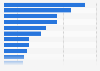
In 2024, X (formerly Twitter) posts saw a year-over-year change in impressions of 98.24 percent. Interactions saw a change of 8.85 percent, and overall engagement decreased by -38.05 percent.
Advertisement
Advertisement
Year-over-year engagement rate of X (formerly Twitter) posts from 2023 to 2024
Profit from the additional features of your individual account
Currently, you are using a shared account. To use individual functions (e.g., mark statistics as favourites, set
statistic alerts) please log in with your personal account.
If you are an admin, please authenticate by logging in again.
Learn more about how Statista can support your business.
Metricool. (August 1, 2024). Year-over-year engagement rate of X (formerly Twitter) posts from 2023 to 2024 [Graph]. In Statista. Retrieved June 26, 2025, from https://www.statista.com/statistics/1483817/x-twitter-yoy-engagement-rate/
Metricool. "Year-over-year engagement rate of X (formerly Twitter) posts from 2023 to 2024." Chart. August 1, 2024. Statista. Accessed June 26, 2025. https://www.statista.com/statistics/1483817/x-twitter-yoy-engagement-rate/
Metricool. (2024). Year-over-year engagement rate of X (formerly Twitter) posts from 2023 to 2024. Statista. Statista Inc.. Accessed: June 26, 2025. https://www.statista.com/statistics/1483817/x-twitter-yoy-engagement-rate/
Metricool. "Year-over-year Engagement Rate of X (Formerly Twitter) Posts from 2023 to 2024." Statista, Statista Inc., 1 Aug 2024, https://www.statista.com/statistics/1483817/x-twitter-yoy-engagement-rate/
Metricool, Year-over-year engagement rate of X (formerly Twitter) posts from 2023 to 2024 Statista, https://www.statista.com/statistics/1483817/x-twitter-yoy-engagement-rate/ (last visited June 26, 2025)
Year-over-year engagement rate of X (formerly Twitter) posts from 2023 to 2024 [Graph], Metricool, August 1, 2024. [Online]. Available: https://www.statista.com/statistics/1483817/x-twitter-yoy-engagement-rate/