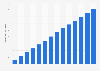
In 2023, Brazil exported approximately 298,090 metric tons of processed plastics. In the same year, the South American country reported roughly 754,000 metric tons of imported processed plastics.
Advertisement
Advertisement
Exports of processed plastics from Brazil from 2010 to 2023
(in 1,000 metric tons)
Adjust the presentation of the statistic and data points.
Share the statistic on social media channels or embed the statistic in your
website using "Embed Code", where available.
Cite this statistic and select one of the following formats: APA, Chicago, Harvard, MLA & Bluebook.
Print the statistic including description and metadata.
Chart type
Exports of processed plastics from Brazil from 2010 to 2023
Share this statistic
You have no right to use this feature.
Make sure to contact us if you are interested in scientific citation.
You can upgrade your account to enable this functionality for all statistics.
This feature is not available with your current account.Request access
The source provides the following additional information: "For foreign trade of plastic, Chapter 39 of the MERCOSUR Common Nomenclature (NCM) must be considered. Some plastic goods may be classified under other specific categories such as plastic auto-parts, synthetic fabrics, etc. The proportion of plastic goods classified under Chapter 39 is 80 percent; the remaining 20 percent is distributed among other classifications."
Learn more about how Statista can support your business.
Associação Brasileira da Indústria do Plástico. (September 24, 2024). Exports of processed plastics from Brazil from 2010 to 2023 (in 1,000 metric tons) [Graph]. In Statista. Retrieved July 03, 2025, from https://www.statista.com/statistics/1494113/brazilian-processed-plastic-export-volume/
Associação Brasileira da Indústria do Plástico. "Exports of processed plastics from Brazil from 2010 to 2023 (in 1,000 metric tons)." Chart. September 24, 2024. Statista. Accessed July 03, 2025. https://www.statista.com/statistics/1494113/brazilian-processed-plastic-export-volume/
Associação Brasileira da Indústria do Plástico. (2024). Exports of processed plastics from Brazil from 2010 to 2023 (in 1,000 metric tons). Statista. Statista Inc.. Accessed: July 03, 2025. https://www.statista.com/statistics/1494113/brazilian-processed-plastic-export-volume/
Associação Brasileira da Indústria do Plástico. "Exports of Processed Plastics from Brazil from 2010 to 2023 (in 1,000 Metric Tons)." Statista, Statista Inc., 24 Sep 2024, https://www.statista.com/statistics/1494113/brazilian-processed-plastic-export-volume/
Associação Brasileira da Indústria do Plástico, Exports of processed plastics from Brazil from 2010 to 2023 (in 1,000 metric tons) Statista, https://www.statista.com/statistics/1494113/brazilian-processed-plastic-export-volume/ (last visited July 03, 2025)
Exports of processed plastics from Brazil from 2010 to 2023 (in 1,000 metric tons) [Graph], Associação Brasileira da Indústria do Plástico, September 24, 2024. [Online]. Available: https://www.statista.com/statistics/1494113/brazilian-processed-plastic-export-volume/
Advertisement
Profit from additional features with an Employee Account
Please create an employee account to be able to mark statistics as favorites.
Then you can access your favorite statistics via the star in the header.
Profit from the additional features of your individual account
Currently, you are using a shared account. To use individual functions (e.g., mark statistics as favourites, set
statistic alerts) please log in with your personal account.
If you are an admin, please authenticate by logging in again.