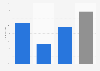
In 2023, 95.48 percent of adults in the Netherlands aged between 16 to 74 years used e-government services. This represents a slight decrease from the previous year when this rate stood at 96.85 percentage points.
Share of e-government users in the Netherlands from 2022 to 2023
Profit from the additional features of your individual account
Currently, you are using a shared account. To use individual functions (e.g., mark statistics as favourites, set
statistic alerts) please log in with your personal account.
If you are an admin, please authenticate by logging in again.
Learn more about how Statista can support your business.
European Commission, & Capgemini. (April 3, 2024). Share of e-government users in the Netherlands from 2022 to 2023 [Graph]. In Statista. Retrieved June 08, 2025, from https://www.statista.com/statistics/1496249/e-gov-usage-reach-netherlands/
European Commission, und Capgemini. "Share of e-government users in the Netherlands from 2022 to 2023." Chart. April 3, 2024. Statista. Accessed June 08, 2025. https://www.statista.com/statistics/1496249/e-gov-usage-reach-netherlands/
European Commission, Capgemini. (2024). Share of e-government users in the Netherlands from 2022 to 2023. Statista. Statista Inc.. Accessed: June 08, 2025. https://www.statista.com/statistics/1496249/e-gov-usage-reach-netherlands/
European Commission, and Capgemini. "Share of E-government Users in The Netherlands from 2022 to 2023." Statista, Statista Inc., 3 Apr 2024, https://www.statista.com/statistics/1496249/e-gov-usage-reach-netherlands/
European Commission & Capgemini, Share of e-government users in the Netherlands from 2022 to 2023 Statista, https://www.statista.com/statistics/1496249/e-gov-usage-reach-netherlands/ (last visited June 08, 2025)
Share of e-government users in the Netherlands from 2022 to 2023 [Graph], European Commission, & Capgemini, April 3, 2024. [Online]. Available: https://www.statista.com/statistics/1496249/e-gov-usage-reach-netherlands/