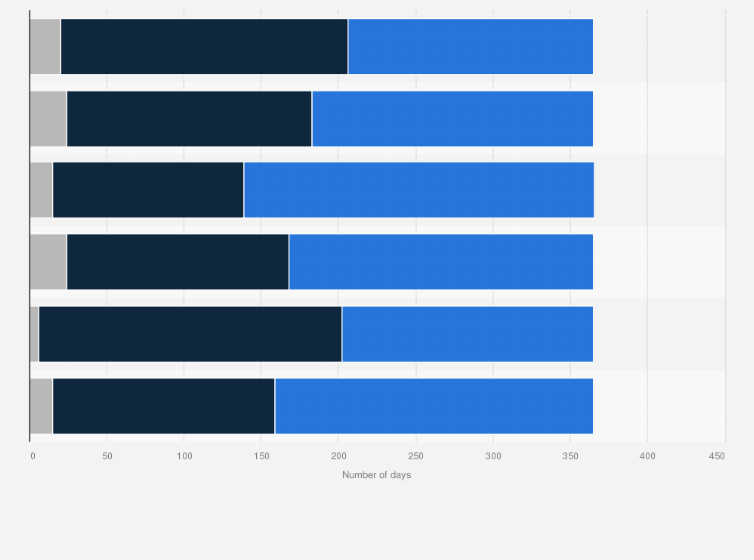
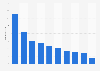
days in India's capital city Delhi had air quality levels ranging from poor to very poor.
**
Log in or register to access precise data.
days witnessed air quality in severe to severe plus category. 2020 was the best year during the recorded period with the highest number of days ranging from good to moderate category, due to nationwide lockdown because of the Covid pandemic.
Adjust the presentation of the statistic and data points.
Share the statistic on social media channels or embed the statistic in your
website using "Embed Code", where available.
Cite this statistic and select one of the following formats: APA, Chicago, Harvard, MLA & Bluebook.
Print the statistic including description and metadata.
Chart type
Air quality levels in Delhi in India from 2016 to 2023, by number of days
Share this statistic
You have no right to use this feature.
Make sure to contact us if you are interested in scientific citation.
You can upgrade your account to enable this functionality for all statistics.
This feature is not available with your current account.Request access
AQI of 50 or lower is considered as ‘good’, between 51 and 100 as ‘satisfactory’, between 101 and 200 as ‘moderate’, between 201 and 300 as ‘poor’, between 301 and 400 as ‘very poor’, and over 400 as ‘severe’.
Learn more about how Statista can support your business.
CNN News18. (October 4, 2024). Air quality levels in Delhi in India from 2016 to 2023, by number of days [Graph]. In Statista. Retrieved June 27, 2025, from https://www.statista.com/statistics/1538108/india-air-quality-levels-in-delhi-by-number-of-days/
CNN News18. "Air quality levels in Delhi in India from 2016 to 2023, by number of days ." Chart. October 4, 2024. Statista. Accessed June 27, 2025. https://www.statista.com/statistics/1538108/india-air-quality-levels-in-delhi-by-number-of-days/
CNN News18. (2024). Air quality levels in Delhi in India from 2016 to 2023, by number of days . Statista. Statista Inc.. Accessed: June 27, 2025. https://www.statista.com/statistics/1538108/india-air-quality-levels-in-delhi-by-number-of-days/
CNN News18. "Air Quality Levels in Delhi in India from 2016 to 2023, by Number of Days ." Statista, Statista Inc., 4 Oct 2024, https://www.statista.com/statistics/1538108/india-air-quality-levels-in-delhi-by-number-of-days/
CNN News18, Air quality levels in Delhi in India from 2016 to 2023, by number of days Statista, https://www.statista.com/statistics/1538108/india-air-quality-levels-in-delhi-by-number-of-days/ (last visited June 27, 2025)
Air quality levels in Delhi in India from 2016 to 2023, by number of days [Graph], CNN News18, October 4, 2024. [Online]. Available: https://www.statista.com/statistics/1538108/india-air-quality-levels-in-delhi-by-number-of-days/
Advertisement
Profit from additional features with an Employee Account
Please create an employee account to be able to mark statistics as favorites.
Then you can access your favorite statistics via the star in the header.
Profit from the additional features of your individual account
Currently, you are using a shared account. To use individual functions (e.g., mark statistics as favourites, set
statistic alerts) please log in with your personal account.
If you are an admin, please authenticate by logging in again.