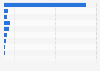
A survey from 2023 found that around 74 percent of non-Hispanic Asian adults in the United States had a dental visit in the past year. In comparison, only 58 percent of Hispanics had a dental visit in the past year.
Percentage of adults in the United States who had a dental visit in the past year as of 2023, by race/ethnicity
Profit from the additional features of your individual account
Currently, you are using a shared account. To use individual functions (e.g., mark statistics as favourites, set
statistic alerts) please log in with your personal account.
If you are an admin, please authenticate by logging in again.
Learn more about how Statista can support your business.
CareQuest Institute for Oral Health. (June 27, 2023). Percentage of adults in the United States who had a dental visit in the past year as of 2023, by race/ethnicity [Graph]. In Statista. Retrieved May 09, 2025, from https://www.statista.com/statistics/1548468/past-year-dental-visit-adults-us-by-race-ethnicity/
CareQuest Institute for Oral Health. "Percentage of adults in the United States who had a dental visit in the past year as of 2023, by race/ethnicity." Chart. June 27, 2023. Statista. Accessed May 09, 2025. https://www.statista.com/statistics/1548468/past-year-dental-visit-adults-us-by-race-ethnicity/
CareQuest Institute for Oral Health. (2023). Percentage of adults in the United States who had a dental visit in the past year as of 2023, by race/ethnicity. Statista. Statista Inc.. Accessed: May 09, 2025. https://www.statista.com/statistics/1548468/past-year-dental-visit-adults-us-by-race-ethnicity/
CareQuest Institute for Oral Health. "Percentage of Adults in The United States Who Had a Dental Visit in The past Year as of 2023, by Race/Ethnicity." Statista, Statista Inc., 27 Jun 2023, https://www.statista.com/statistics/1548468/past-year-dental-visit-adults-us-by-race-ethnicity/
CareQuest Institute for Oral Health, Percentage of adults in the United States who had a dental visit in the past year as of 2023, by race/ethnicity Statista, https://www.statista.com/statistics/1548468/past-year-dental-visit-adults-us-by-race-ethnicity/ (last visited May 09, 2025)
Percentage of adults in the United States who had a dental visit in the past year as of 2023, by race/ethnicity [Graph], CareQuest Institute for Oral Health, June 27, 2023. [Online]. Available: https://www.statista.com/statistics/1548468/past-year-dental-visit-adults-us-by-race-ethnicity/