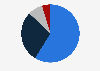
In 2023, approximately 78.3 percent of Chinese consumers purchased pre-owned items. Pre-owned electronics emerged as the most popular category in second-hand shopping.
Share of consumers who purchased second-hand items in China as of 2023
Profit from the additional features of your individual account
Currently, you are using a shared account. To use individual functions (e.g., mark statistics as favourites, set
statistic alerts) please log in with your personal account.
If you are an admin, please authenticate by logging in again.
Learn more about how Statista can support your business.
199IT. (October 9, 2024). Share of consumers who purchased second-hand items in China as of 2023 [Graph]. In Statista. Retrieved May 17, 2025, from https://www.statista.com/statistics/1549854/china-consumers-who-bought-second-hand-items/
199IT. "Share of consumers who purchased second-hand items in China as of 2023." Chart. October 9, 2024. Statista. Accessed May 17, 2025. https://www.statista.com/statistics/1549854/china-consumers-who-bought-second-hand-items/
199IT. (2024). Share of consumers who purchased second-hand items in China as of 2023. Statista. Statista Inc.. Accessed: May 17, 2025. https://www.statista.com/statistics/1549854/china-consumers-who-bought-second-hand-items/
199IT. "Share of Consumers Who Purchased Second-hand Items in China as of 2023." Statista, Statista Inc., 9 Oct 2024, https://www.statista.com/statistics/1549854/china-consumers-who-bought-second-hand-items/
199IT, Share of consumers who purchased second-hand items in China as of 2023 Statista, https://www.statista.com/statistics/1549854/china-consumers-who-bought-second-hand-items/ (last visited May 17, 2025)
Share of consumers who purchased second-hand items in China as of 2023 [Graph], 199IT, October 9, 2024. [Online]. Available: https://www.statista.com/statistics/1549854/china-consumers-who-bought-second-hand-items/