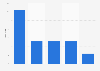
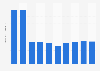
According to a survey on consumer life in South Korea in 2023, customers of department stores visited there around two times on average per month. This has stayed the same since 2019.
Frequency of visiting department stores in South Korea from 2019 to 2023
Profit from the additional features of your individual account
Currently, you are using a shared account. To use individual functions (e.g., mark statistics as favourites, set
statistic alerts) please log in with your personal account.
If you are an admin, please authenticate by logging in again.
Learn more about how Statista can support your business.
KCA. (June 19, 2024). Frequency of visiting department stores in South Korea from 2019 to 2023 [Graph]. In Statista. Retrieved May 17, 2025, from https://www.statista.com/statistics/1551031/south-korea-average-monthly-visits-to-department-store/
KCA. "Frequency of visiting department stores in South Korea from 2019 to 2023." Chart. June 19, 2024. Statista. Accessed May 17, 2025. https://www.statista.com/statistics/1551031/south-korea-average-monthly-visits-to-department-store/
KCA. (2024). Frequency of visiting department stores in South Korea from 2019 to 2023. Statista. Statista Inc.. Accessed: May 17, 2025. https://www.statista.com/statistics/1551031/south-korea-average-monthly-visits-to-department-store/
KCA. "Frequency of Visiting Department Stores in South Korea from 2019 to 2023." Statista, Statista Inc., 19 Jun 2024, https://www.statista.com/statistics/1551031/south-korea-average-monthly-visits-to-department-store/
KCA, Frequency of visiting department stores in South Korea from 2019 to 2023 Statista, https://www.statista.com/statistics/1551031/south-korea-average-monthly-visits-to-department-store/ (last visited May 17, 2025)
Frequency of visiting department stores in South Korea from 2019 to 2023 [Graph], KCA, June 19, 2024. [Online]. Available: https://www.statista.com/statistics/1551031/south-korea-average-monthly-visits-to-department-store/