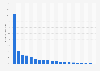
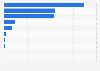
In 2024, Australia's commercial motor vehicle import value amounted to around **** billion U.S. dollars, the highest in the Asia-Pacific region for this category. The Philippines followed, importing approximately **** billion U.S. dollars worth of commercial motor vehicles.
Profit from the additional features of your individual account
Currently, you are using a shared account. To use individual functions (e.g., mark statistics as favourites, set
statistic alerts) please log in with your personal account.
If you are an admin, please authenticate by logging in again.
Learn more about how Statista can support your business.
Trade Map. (June 9, 2025). Import value of motor vehicles for the transport of goods in the Asia-Pacific region in 2024, by country or territory (in billion U.S. dollars) [Graph]. In Statista. Retrieved July 12, 2025, from https://www.statista.com/statistics/1557148/apac-commercial-motor-vehicle-import-value-by-country/
Trade Map. "Import value of motor vehicles for the transport of goods in the Asia-Pacific region in 2024, by country or territory (in billion U.S. dollars)." Chart. June 9, 2025. Statista. Accessed July 12, 2025. https://www.statista.com/statistics/1557148/apac-commercial-motor-vehicle-import-value-by-country/
Trade Map. (2025). Import value of motor vehicles for the transport of goods in the Asia-Pacific region in 2024, by country or territory (in billion U.S. dollars). Statista. Statista Inc.. Accessed: July 12, 2025. https://www.statista.com/statistics/1557148/apac-commercial-motor-vehicle-import-value-by-country/
Trade Map. "Import Value of Motor Vehicles for The Transport of Goods in The Asia-pacific Region in 2024, by Country or Territory (in Billion U.S. Dollars)." Statista, Statista Inc., 9 Jun 2025, https://www.statista.com/statistics/1557148/apac-commercial-motor-vehicle-import-value-by-country/
Trade Map, Import value of motor vehicles for the transport of goods in the Asia-Pacific region in 2024, by country or territory (in billion U.S. dollars) Statista, https://www.statista.com/statistics/1557148/apac-commercial-motor-vehicle-import-value-by-country/ (last visited July 12, 2025)
Import value of motor vehicles for the transport of goods in the Asia-Pacific region in 2024, by country or territory (in billion U.S. dollars) [Graph], Trade Map, June 9, 2025. [Online]. Available: https://www.statista.com/statistics/1557148/apac-commercial-motor-vehicle-import-value-by-country/