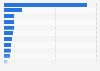
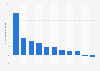
The average revenue per capita of energy and sports drinks in Canada was forecast to continuously increase between 2025 and 2029 by in total 3.1 U.S. dollars (+12.15 percent). After the seventh consecutive increasing year, the average revenue per capita, is estimated to reach 28.59 U.S. dollars and therefore a new peak in 2029.
Advertisement
Advertisement
Average revenue per capita of energy and sports drinks in Canada from 2018 to 2029
(in U.S. dollars)
Data provided by Statista Market Insights are estimates.
Definition:
The Energy & Sports Drinks market includes energy drinks and sports drinks. Energy drinks are a type of beverage containing stimulant compounds, which are marketed as providing functional benefits such as mental and physical stimulation. The functionality of an energy drink is typically obtained from ingredients such as caffeine, taurine, and glucose. Coffee, tea, and other naturally caffeinated drinks, as well as caffeinated soft drinks such as cola, are not considered energy drinks. Sports drinks are functional beverages specifically designed to help athletes and other active people replace water, electrolytes, and energy before, during, and after exercise.
Additional information:
The market comprises revenue and average revenue per capita, volume and average volume per capita, price per liter, as well as sales channels. Per capita figures refer to a country’s or region’s whole population.
The at-home market covers retail sales via super- and hypermarkets, eCommerce, convenience stores, or similar sales channels. The out-of-home data encompasses all sales to hotels, restaurants, catering, cafés, bars, and similar hospitality service establishments. Combined numbers encompass both the at-home market and the out-of-home market. Both the at-home and the out-of-home market are valued at retail selling prices including all sales and consumption taxes.
Key players include Red Bull, Monster, and Rockstar.
Profit from the additional features of your individual account
Currently, you are using a shared account. To use individual functions (e.g., mark statistics as favourites, set
statistic alerts) please log in with your personal account.
If you are an admin, please authenticate by logging in again.
Learn more about how Statista can support your business.
Statista. (February 17, 2025). Average revenue per capita of energy and sports drinks in Canada from 2018 to 2029 (in U.S. dollars) [Graph]. In Statista. Retrieved June 13, 2025, from https://www.statista.com/statistics/1558426/average-revenue-per-capita-of-energy-and-sports-drinks-in-canada/
Statista. "Average revenue per capita of energy and sports drinks in Canada from 2018 to 2029 (in U.S. dollars)." Chart. February 17, 2025. Statista. Accessed June 13, 2025. https://www.statista.com/statistics/1558426/average-revenue-per-capita-of-energy-and-sports-drinks-in-canada/
Statista. (2025). Average revenue per capita of energy and sports drinks in Canada from 2018 to 2029 (in U.S. dollars). Statista. Statista Inc.. Accessed: June 13, 2025. https://www.statista.com/statistics/1558426/average-revenue-per-capita-of-energy-and-sports-drinks-in-canada/
Statista. "Average Revenue per Capita of Energy and Sports Drinks in Canada from 2018 to 2029 (in U.S. Dollars)." Statista, Statista Inc., 17 Feb 2025, https://www.statista.com/statistics/1558426/average-revenue-per-capita-of-energy-and-sports-drinks-in-canada/
Statista, Average revenue per capita of energy and sports drinks in Canada from 2018 to 2029 (in U.S. dollars) Statista, https://www.statista.com/statistics/1558426/average-revenue-per-capita-of-energy-and-sports-drinks-in-canada/ (last visited June 13, 2025)
Average revenue per capita of energy and sports drinks in Canada from 2018 to 2029 (in U.S. dollars) [Graph], Statista, February 17, 2025. [Online]. Available: https://www.statista.com/statistics/1558426/average-revenue-per-capita-of-energy-and-sports-drinks-in-canada/