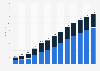
The average revenue per user is forecast to experience significant growth in all segments in 2029. This reflects the overall trend throughout the entire forecast period from 2017 to 2029. It is estimated that the average revenue per user is continuously rising in both segments. In this regard, the grocery delivery segment achieves the highest value of 343.19 U.S. dollars in 2029.
Advertisement
Advertisement
Average revenue per user in the online food delivery market in Latin America from 2017 to 2029
(in U.S. dollars)
Data provided by Statista Market Insights are estimates.
Definition:
Online Food Delivery refers to the intersection of ordering groceries and prepared meals online. Orders are typically placed through an app or website and delivery times vary.
Structure:
The Online Food Delivery market contains the user and revenue development of two different delivery service solutions: (1) Meal Delivery and (2) Grocery Delivery. Included are services that deliver prepared meals and food ordered online for direct consumption (Meal Delivery) and non-prepared food and beverage products, household, and personal care products (Grocery Delivery). Meal delivery includes the delivery of meals carried out directly by restaurants (Restaurant Delivery) and online delivery services that provide customers with meals from partner restaurants that do not necessarily have to offer food delivery themselves (Platform Delivery). Grocery Delivery consists of fresh, nonprepared products delivered from supermarkets or retailers where delivery is scheduled (Retail Delivery), Delivery that is under 3 hours and operates dark stores or own warehouses (Quick Commerce), and prepared fresh ingredients to be prepared at home, typically offered through a subscription service (Meal Kit Delivery).
Additional Information:
Revenue figures are the gross merchandise value (GMV), defined as the total sales dollar value for merchandise/food sold through the Online Food Delivery marketplace. User and revenue figures represent B2C services.
Profit from the additional features of your individual account
Currently, you are using a shared account. To use individual functions (e.g., mark statistics as favourites, set
statistic alerts) please log in with your personal account.
If you are an admin, please authenticate by logging in again.
Learn more about how Statista can support your business.
Statista. (February 26, 2025). Average revenue per user in the online food delivery market in Latin America from 2017 to 2029 (in U.S. dollars) [Graph]. In Statista. Retrieved June 13, 2025, from https://www.statista.com/statistics/1559858/online-food-delivery-arpu-latin-america/
Statista. "Average revenue per user in the online food delivery market in Latin America from 2017 to 2029 (in U.S. dollars)." Chart. February 26, 2025. Statista. Accessed June 13, 2025. https://www.statista.com/statistics/1559858/online-food-delivery-arpu-latin-america/
Statista. (2025). Average revenue per user in the online food delivery market in Latin America from 2017 to 2029 (in U.S. dollars). Statista. Statista Inc.. Accessed: June 13, 2025. https://www.statista.com/statistics/1559858/online-food-delivery-arpu-latin-america/
Statista. "Average Revenue per User in The Online Food Delivery Market in Latin America from 2017 to 2029 (in U.S. Dollars)." Statista, Statista Inc., 26 Feb 2025, https://www.statista.com/statistics/1559858/online-food-delivery-arpu-latin-america/
Statista, Average revenue per user in the online food delivery market in Latin America from 2017 to 2029 (in U.S. dollars) Statista, https://www.statista.com/statistics/1559858/online-food-delivery-arpu-latin-america/ (last visited June 13, 2025)
Average revenue per user in the online food delivery market in Latin America from 2017 to 2029 (in U.S. dollars) [Graph], Statista, February 26, 2025. [Online]. Available: https://www.statista.com/statistics/1559858/online-food-delivery-arpu-latin-america/