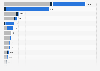
In 2023, the EU imported services from the U.S. worth 396 billion euros. Intellectual property was the most imported service, accounting for 38 percent of the total.
Advertisement
Advertisement
Share of U.S. services imported to the European Union in 2023
Characteristic
Share of imported services from the U.S.
Intellectual property
38%
Various business services*
29.1%
ICT
9.7%
Transport
8.2%
Financial
5.3%
Other**
9.7%
• Intellectual property 38%
• Various business services* 29.1%
• ICT 9.7%
• Transport 8.2%
• Financial 5.3%
• Other** 9.7%
Add this content to your personal favorites. These can be accessed from the favorites menu in the main navigation.
You have no right to use this feature.
Make sure to contact us if you are interested in scientific citation.
You can upgrade your account to enable this functionality for all statistics.
This feature is not available with your current account.Request access
*Various business services includes: legal, accounting, consulting, public relations, research and development, architectural, engineering, scientific, advertising, market research, public opinion, trade-related, operating leasing, waste treatment, de-pollution.
**Others: insurance and pensions, manufacturing, construction, maintenance and repair, government goods and services, personal, cultural and recreational and travel
Learn more about how Statista can support your business.
European University Institute, & European Parliamentary Research Service. (October 22, 2024). Share of U.S. services imported to the European Union in 2023 [Graph]. In Statista. Retrieved June 12, 2025, from https://www.statista.com/statistics/1609523/share-of-services-imported-from-the-us-to-the-eu/
European University Institute, und European Parliamentary Research Service. "Share of U.S. services imported to the European Union in 2023." Chart. October 22, 2024. Statista. Accessed June 12, 2025. https://www.statista.com/statistics/1609523/share-of-services-imported-from-the-us-to-the-eu/
European University Institute, European Parliamentary Research Service. (2024). Share of U.S. services imported to the European Union in 2023. Statista. Statista Inc.. Accessed: June 12, 2025. https://www.statista.com/statistics/1609523/share-of-services-imported-from-the-us-to-the-eu/
European University Institute, and European Parliamentary Research Service. "Share of U.S. Services Imported to The European Union in 2023." Statista, Statista Inc., 22 Oct 2024, https://www.statista.com/statistics/1609523/share-of-services-imported-from-the-us-to-the-eu/
European University Institute & European Parliamentary Research Service, Share of U.S. services imported to the European Union in 2023 Statista, https://www.statista.com/statistics/1609523/share-of-services-imported-from-the-us-to-the-eu/ (last visited June 12, 2025)
Share of U.S. services imported to the European Union in 2023 [Graph], European University Institute, & European Parliamentary Research Service, October 22, 2024. [Online]. Available: https://www.statista.com/statistics/1609523/share-of-services-imported-from-the-us-to-the-eu/
Advertisement
Profit from additional features with an Employee Account
Please create an employee account to be able to mark statistics as favorites.
Then you can access your favorite statistics via the star in the header.
Profit from the additional features of your individual account
Currently, you are using a shared account. To use individual functions (e.g., mark statistics as favourites, set
statistic alerts) please log in with your personal account.
If you are an admin, please authenticate by logging in again.