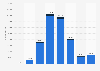
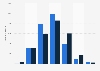
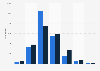
Greenhouse gas (GHG) emissions from buildings in the United Kingdom decreased significantly in 2022 and 2023. Over the past few decades, the residential sector decreased its emissions at a much higher rate than other types of buildings. However, in 2023, the residential sector was responsible for more than **** of all GHG emissions coming from buildings.
Greenhouse gas emissions from buildings and product uses in the United Kingdom (UK) from 1990 to 2023, by subsegment
(in million metric tons of carbon dioxide equivalent)
Profit from the additional features of your individual account
Currently, you are using a shared account. To use individual functions (e.g., mark statistics as favourites, set
statistic alerts) please log in with your personal account.
If you are an admin, please authenticate by logging in again.
Learn more about how Statista can support your business.
Department for Energy Security and Net-Zero (UK), & Statista. (February 6, 2025). Greenhouse gas emissions from buildings and product uses in the United Kingdom (UK) from 1990 to 2023, by subsegment (in million metric tons of carbon dioxide equivalent) [Graph]. In Statista. Retrieved June 17, 2025, from https://www.statista.com/statistics/1614091/uk-ghg-emissions-from-buildings-by-source/
Department for Energy Security and Net-Zero (UK), und Statista. "Greenhouse gas emissions from buildings and product uses in the United Kingdom (UK) from 1990 to 2023, by subsegment (in million metric tons of carbon dioxide equivalent)." Chart. February 6, 2025. Statista. Accessed June 17, 2025. https://www.statista.com/statistics/1614091/uk-ghg-emissions-from-buildings-by-source/
Department for Energy Security and Net-Zero (UK), Statista. (2025). Greenhouse gas emissions from buildings and product uses in the United Kingdom (UK) from 1990 to 2023, by subsegment (in million metric tons of carbon dioxide equivalent). Statista. Statista Inc.. Accessed: June 17, 2025. https://www.statista.com/statistics/1614091/uk-ghg-emissions-from-buildings-by-source/
Department for Energy Security and Net-Zero (UK), and Statista. "Greenhouse Gas Emissions from Buildings and Product Uses in The United Kingdom (Uk) from 1990 to 2023, by Subsegment (in Million Metric Tons of Carbon Dioxide Equivalent)." Statista, Statista Inc., 6 Feb 2025, https://www.statista.com/statistics/1614091/uk-ghg-emissions-from-buildings-by-source/
Department for Energy Security and Net-Zero (UK) & Statista, Greenhouse gas emissions from buildings and product uses in the United Kingdom (UK) from 1990 to 2023, by subsegment (in million metric tons of carbon dioxide equivalent) Statista, https://www.statista.com/statistics/1614091/uk-ghg-emissions-from-buildings-by-source/ (last visited June 17, 2025)
Greenhouse gas emissions from buildings and product uses in the United Kingdom (UK) from 1990 to 2023, by subsegment (in million metric tons of carbon dioxide equivalent) [Graph], Department for Energy Security and Net-Zero (UK), & Statista, February 6, 2025. [Online]. Available: https://www.statista.com/statistics/1614091/uk-ghg-emissions-from-buildings-by-source/