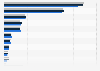
In 2023, plastic resin accounted for the highest share of production costs in the plastics production industry. In that year, the share of the cost of plastic resin amounted to ***percent in the production of plastic bags.
Profit from the additional features of your individual account
Currently, you are using a shared account. To use individual functions (e.g., mark statistics as favourites, set
statistic alerts) please log in with your personal account.
If you are an admin, please authenticate by logging in again.
Learn more about how Statista can support your business.
Krungsri Research. (March 28, 2025). Cost structure of plastic production in Thailand in 2023, by product type [Graph]. In Statista. Retrieved July 14, 2025, from https://www.statista.com/statistics/1614338/thailand-cost-structure-of-plastic-production/
Krungsri Research. "Cost structure of plastic production in Thailand in 2023, by product type." Chart. March 28, 2025. Statista. Accessed July 14, 2025. https://www.statista.com/statistics/1614338/thailand-cost-structure-of-plastic-production/
Krungsri Research. (2025). Cost structure of plastic production in Thailand in 2023, by product type. Statista. Statista Inc.. Accessed: July 14, 2025. https://www.statista.com/statistics/1614338/thailand-cost-structure-of-plastic-production/
Krungsri Research. "Cost Structure of Plastic Production in Thailand in 2023, by Product Type." Statista, Statista Inc., 28 Mar 2025, https://www.statista.com/statistics/1614338/thailand-cost-structure-of-plastic-production/
Krungsri Research, Cost structure of plastic production in Thailand in 2023, by product type Statista, https://www.statista.com/statistics/1614338/thailand-cost-structure-of-plastic-production/ (last visited July 14, 2025)
Cost structure of plastic production in Thailand in 2023, by product type [Graph], Krungsri Research, March 28, 2025. [Online]. Available: https://www.statista.com/statistics/1614338/thailand-cost-structure-of-plastic-production/