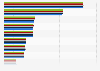
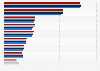
Dairy products include fluid milk and cream products, cheese, frozen dairy products, evaporated and condensed milk and dry dairy products.
All per capita consumption figures are calculated using resident population plus the Armed Forces overseas, except fluid milk figures, which are calculated using resident population only.
Figures are computed from unrounded data.
Profit from the additional features of your individual account
Currently, you are using a shared account. To use individual functions (e.g., mark statistics as favourites, set
statistic alerts) please log in with your personal account.
If you are an admin, please authenticate by logging in again.
Learn more about how Statista can support your business.
US Department of Agriculture, & Economic Research Service. (November 26, 2024). Per capita consumption of dairy products in the United States from 2000 to 2023 (in pounds) [Graph]. In Statista. Retrieved June 20, 2025, from https://www.statista.com/statistics/183717/per-capita-consumption-of-dairy-products-in-the-us-since-2000/
US Department of Agriculture, und Economic Research Service. "Per capita consumption of dairy products in the United States from 2000 to 2023 (in pounds)." Chart. November 26, 2024. Statista. Accessed June 20, 2025. https://www.statista.com/statistics/183717/per-capita-consumption-of-dairy-products-in-the-us-since-2000/
US Department of Agriculture, Economic Research Service. (2024). Per capita consumption of dairy products in the United States from 2000 to 2023 (in pounds). Statista. Statista Inc.. Accessed: June 20, 2025. https://www.statista.com/statistics/183717/per-capita-consumption-of-dairy-products-in-the-us-since-2000/
US Department of Agriculture, and Economic Research Service. "Per Capita Consumption of Dairy Products in The United States from 2000 to 2023 (in Pounds)." Statista, Statista Inc., 26 Nov 2024, https://www.statista.com/statistics/183717/per-capita-consumption-of-dairy-products-in-the-us-since-2000/
US Department of Agriculture & Economic Research Service, Per capita consumption of dairy products in the United States from 2000 to 2023 (in pounds) Statista, https://www.statista.com/statistics/183717/per-capita-consumption-of-dairy-products-in-the-us-since-2000/ (last visited June 20, 2025)
Per capita consumption of dairy products in the United States from 2000 to 2023 (in pounds) [Graph], US Department of Agriculture, & Economic Research Service, November 26, 2024. [Online]. Available: https://www.statista.com/statistics/183717/per-capita-consumption-of-dairy-products-in-the-us-since-2000/