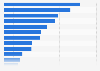
The timeline pictures the per capita consumption of Italian cheese in the United States from 2000 to 2022. The U.S. per capita consumption of Italian cheese amounted to about 16.14 pounds in 2022, up from 15.88 pounds in 2021.
Advertisement
Advertisement
Per capita consumption of Italian cheese in the United States from 2000 to 2022
(in pounds)
Characteristic
Per capita consumption in pounds
2022
16.14
2021
15.88
2020
15.51
2019
15.88
2018
15.71
2017
15.12
2016
15.24
2015
14.48
2014
14.2
2013
13.84
2012
13.81
2011
13.98
2010
13.54
02.557.51012.51517.520
Add this content to your personal favorites. These can be accessed from the favorites menu in the main navigation.
You have no right to use this feature.
Make sure to contact us if you are interested in scientific citation.
You can upgrade your account to enable this functionality for all statistics.
This feature is not available with your current account.Request access
According to ERS all per capita consumption figures are calculated using resident population plus the Armed Forces overseas. Italian cheese includes Provolone, Romano, Parmesan, Mozzarella, Ricotta and other. Figures are computed from unrounded data.
Learn more about how Statista can support your business.
Economic Research Service, & US Department of Agriculture. (November 30, 2023). Per capita consumption of Italian cheese in the United States from 2000 to 2022 (in pounds) [Graph]. In Statista. Retrieved June 30, 2025, from https://www.statista.com/statistics/183949/per-capita-consumption-of-italian-cheese-in-the-us-since-2000/
Economic Research Service, und US Department of Agriculture. "Per capita consumption of Italian cheese in the United States from 2000 to 2022 (in pounds)." Chart. November 30, 2023. Statista. Accessed June 30, 2025. https://www.statista.com/statistics/183949/per-capita-consumption-of-italian-cheese-in-the-us-since-2000/
Economic Research Service, US Department of Agriculture. (2023). Per capita consumption of Italian cheese in the United States from 2000 to 2022 (in pounds). Statista. Statista Inc.. Accessed: June 30, 2025. https://www.statista.com/statistics/183949/per-capita-consumption-of-italian-cheese-in-the-us-since-2000/
Economic Research Service, and US Department of Agriculture. "Per Capita Consumption of Italian Cheese in The United States from 2000 to 2022 (in Pounds)." Statista, Statista Inc., 30 Nov 2023, https://www.statista.com/statistics/183949/per-capita-consumption-of-italian-cheese-in-the-us-since-2000/
Economic Research Service & US Department of Agriculture, Per capita consumption of Italian cheese in the United States from 2000 to 2022 (in pounds) Statista, https://www.statista.com/statistics/183949/per-capita-consumption-of-italian-cheese-in-the-us-since-2000/ (last visited June 30, 2025)
Per capita consumption of Italian cheese in the United States from 2000 to 2022 (in pounds) [Graph], Economic Research Service, & US Department of Agriculture, November 30, 2023. [Online]. Available: https://www.statista.com/statistics/183949/per-capita-consumption-of-italian-cheese-in-the-us-since-2000/
Advertisement
Profit from additional features with an Employee Account
Please create an employee account to be able to mark statistics as favorites.
Then you can access your favorite statistics via the star in the header.
Profit from the additional features of your individual account
Currently, you are using a shared account. To use individual functions (e.g., mark statistics as favourites, set
statistic alerts) please log in with your personal account.
If you are an admin, please authenticate by logging in again.