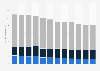
In 2023, the per capita consumption of fluid milk products in the United States was about 128 pounds per person. Compared to 196 pounds in 2000, the average per capita consumption has decreased by over 60 pounds since then.
Advertisement
Advertisement
Per capita consumption of fluid milk products in the United States from 2000 to 2023 (in pounds)*
Characteristic
Per capita consumption in pounds**
2023
128
2022
130
2021
134
2020
141
2019
141
2018
145
2017
148
2016
153
2015
155
2014
158
2013
164
2012
169
2011
173
050100150200250
Add this content to your personal favorites. These can be accessed from the favorites menu in the main navigation.
You have no right to use this feature.
Make sure to contact us if you are interested in scientific citation.
You can upgrade your account to enable this functionality for all statistics.
This feature is not available with your current account.Request access
* Fluid milk includes the product weight of beverage milks: whole, reduced fat, low fat, skim, flavored, buttermilk, eggnog, and miscellaneous.
** Based on resident population.
Learn more about how Statista can support your business.
US Department of Agriculture, & Economic Research Service. (November 26, 2024). Per capita consumption of fluid milk products in the United States from 2000 to 2023 (in pounds)* [Graph]. In Statista. Retrieved July 13, 2025, from https://www.statista.com/statistics/184240/us-per-capita-consumption-of-fluid-milk-products/
US Department of Agriculture, und Economic Research Service. "Per capita consumption of fluid milk products in the United States from 2000 to 2023 (in pounds)*." Chart. November 26, 2024. Statista. Accessed July 13, 2025. https://www.statista.com/statistics/184240/us-per-capita-consumption-of-fluid-milk-products/
US Department of Agriculture, Economic Research Service. (2024). Per capita consumption of fluid milk products in the United States from 2000 to 2023 (in pounds)*. Statista. Statista Inc.. Accessed: July 13, 2025. https://www.statista.com/statistics/184240/us-per-capita-consumption-of-fluid-milk-products/
US Department of Agriculture, and Economic Research Service. "Per Capita Consumption of Fluid Milk Products in The United States from 2000 to 2023 (in Pounds)*." Statista, Statista Inc., 26 Nov 2024, https://www.statista.com/statistics/184240/us-per-capita-consumption-of-fluid-milk-products/
US Department of Agriculture & Economic Research Service, Per capita consumption of fluid milk products in the United States from 2000 to 2023 (in pounds)* Statista, https://www.statista.com/statistics/184240/us-per-capita-consumption-of-fluid-milk-products/ (last visited July 13, 2025)
Per capita consumption of fluid milk products in the United States from 2000 to 2023 (in pounds)* [Graph], US Department of Agriculture, & Economic Research Service, November 26, 2024. [Online]. Available: https://www.statista.com/statistics/184240/us-per-capita-consumption-of-fluid-milk-products/
Advertisement
Profit from additional features with an Employee Account
Please create an employee account to be able to mark statistics as favorites.
Then you can access your favorite statistics via the star in the header.
Profit from the additional features of your individual account
Currently, you are using a shared account. To use individual functions (e.g., mark statistics as favourites, set
statistic alerts) please log in with your personal account.
If you are an admin, please authenticate by logging in again.