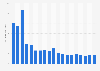
This statistic shows the mean annual out-of-pocket expense for prescribed medicine per person with out-of-pocket expense in the U.S. from 1987 to 2014, by insurance status. In 2014, the mean annual out-of-pocket expense per uninsured person under 65 years came to 359 U.S. dollars.
Advertisement
Advertisement
Mean annual out-of-pocket expense per person for prescribed medicine in the U.S. from 1987 to 2014, by insurance status*
Characteristic
Any private insurance
Public insurance only
Uninsured all year
2014
216
95
359
2013
228
116
394
2012
269
140
363
2011
269
177
351
2010
285
154
383
2009
263
149
389
2008
284
229
544
2007
309
221
482
2006
389
326
634
2005
376
385
613
2004
345
441
583
2003
364
496
551
2002
286
352
561
050100150200250300350400450500550600650700
Add this content to your personal favorites. These can be accessed from the favorites menu in the main navigation.
You have no right to use this feature.
Make sure to contact us if you are interested in scientific citation.
You can upgrade your account to enable this functionality for all statistics.
This feature is not available with your current account.Request access
* Per person with out-of-pocket expense. Estimates of expenses were converted to 2014 dollars using the Consumer Price Index (all items) and differ from previous editions of Health, United States.
Any private insurance includes individuals with insurance that provided coverage for hospital and physician care at any time during the year, other than Medicare, Medicaid, or other public coverage for hospital or physician services. Public insurance only includes individuals who were not covered by private insurance at any time during the year but were covered by Medicare, Medicaid, other public coverage for hospital or physician services, and/or CHAMPUS/CHAMPVA (TRICARE) at any point during the year. Uninsured includes persons not covered by either private or public insurance throughout the entire year or period of eligibility for the survey. Individuals with Indian Health Service coverage only are considered uninsured.
Values not included in the pdf version of "Health, United States" were taken from the excel trend tables.
Learn more about how Statista can support your business.
US Department of Health and Human Services. (September 19, 2018). Mean annual out-of-pocket expense per person for prescribed medicine in the U.S. from 1987 to 2014, by insurance status* [Graph]. In Statista. Retrieved July 06, 2025, from https://www.statista.com/statistics/185085/medicine-out-of-pocket-expense-per-person-by-insurance-status-since-1987/
US Department of Health and Human Services. "Mean annual out-of-pocket expense per person for prescribed medicine in the U.S. from 1987 to 2014, by insurance status* ." Chart. September 19, 2018. Statista. Accessed July 06, 2025. https://www.statista.com/statistics/185085/medicine-out-of-pocket-expense-per-person-by-insurance-status-since-1987/
US Department of Health and Human Services. (2018). Mean annual out-of-pocket expense per person for prescribed medicine in the U.S. from 1987 to 2014, by insurance status* . Statista. Statista Inc.. Accessed: July 06, 2025. https://www.statista.com/statistics/185085/medicine-out-of-pocket-expense-per-person-by-insurance-status-since-1987/
US Department of Health and Human Services. "Mean Annual Out-of-pocket Expense per Person for Prescribed Medicine in The U.S. from 1987 to 2014, by Insurance Status* ." Statista, Statista Inc., 19 Sep 2018, https://www.statista.com/statistics/185085/medicine-out-of-pocket-expense-per-person-by-insurance-status-since-1987/
US Department of Health and Human Services, Mean annual out-of-pocket expense per person for prescribed medicine in the U.S. from 1987 to 2014, by insurance status* Statista, https://www.statista.com/statistics/185085/medicine-out-of-pocket-expense-per-person-by-insurance-status-since-1987/ (last visited July 06, 2025)
Mean annual out-of-pocket expense per person for prescribed medicine in the U.S. from 1987 to 2014, by insurance status* [Graph], US Department of Health and Human Services, September 19, 2018. [Online]. Available: https://www.statista.com/statistics/185085/medicine-out-of-pocket-expense-per-person-by-insurance-status-since-1987/
Advertisement
Profit from additional features with an Employee Account
Please create an employee account to be able to mark statistics as favorites.
Then you can access your favorite statistics via the star in the header.
Profit from the additional features of your individual account
Currently, you are using a shared account. To use individual functions (e.g., mark statistics as favourites, set
statistic alerts) please log in with your personal account.
If you are an admin, please authenticate by logging in again.