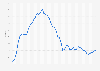
The number of new homes sold increased in 2024, but remained below the levels observed during the 2020-2021 housing boom. Conventional loans are the most popular financing option, accounting for 513,000 of the 686,000 home purchases in 2024. Despite comprising a small share of sales, cash purchases have risen notably over the past five years. This can be explained by the dramatic increase in mortgage interest rates, which makes cash purchases more attractive for those who can afford them.
Development of house prices
The U.S. housing market is suffering a supply shortage, which has contributed to a substantial increase in house prices. Over the past five years, construction costs risen notably, pushing the price of newly built homes up. Meanwhile, income growth has failed to keep up, resulting in a worsening housing affordability. According to the house price to income index, home prices outgrew income by nearly 32 percent between 2015 and 2024.
Is the U.S. housing stock growing?
There were approximately 187 million housing units in the U.S. in 2024, indicating an increase of one percent over the previous year. Apart from new-single family housing, the number of newly built multifamily units has also risen notably. Multifamily allows construction in denser urban areas with overheated housing markets, earning it increasing popularity among investors.
Advertisement
Advertisement
Number of new house sales in the United States from 2000 to 2024, by financing type
(in 1,000s)
Profit from the additional features of your individual account
Currently, you are using a shared account. To use individual functions (e.g., mark statistics as favourites, set
statistic alerts) please log in with your personal account.
If you are an admin, please authenticate by logging in again.
Learn more about how Statista can support your business.
US Census Bureau. (April 23, 2025). Number of new house sales in the United States from 2000 to 2024, by financing type (in 1,000s) [Graph]. In Statista. Retrieved June 13, 2025, from https://www.statista.com/statistics/185206/us-house-sales-with-fha-and-va-insured-mortgages-from-2002/
US Census Bureau. "Number of new house sales in the United States from 2000 to 2024, by financing type (in 1,000s)." Chart. April 23, 2025. Statista. Accessed June 13, 2025. https://www.statista.com/statistics/185206/us-house-sales-with-fha-and-va-insured-mortgages-from-2002/
US Census Bureau. (2025). Number of new house sales in the United States from 2000 to 2024, by financing type (in 1,000s). Statista. Statista Inc.. Accessed: June 13, 2025. https://www.statista.com/statistics/185206/us-house-sales-with-fha-and-va-insured-mortgages-from-2002/
US Census Bureau. "Number of New House Sales in The United States from 2000 to 2024, by Financing Type (in 1,000s)." Statista, Statista Inc., 23 Apr 2025, https://www.statista.com/statistics/185206/us-house-sales-with-fha-and-va-insured-mortgages-from-2002/
US Census Bureau, Number of new house sales in the United States from 2000 to 2024, by financing type (in 1,000s) Statista, https://www.statista.com/statistics/185206/us-house-sales-with-fha-and-va-insured-mortgages-from-2002/ (last visited June 13, 2025)
Number of new house sales in the United States from 2000 to 2024, by financing type (in 1,000s) [Graph], US Census Bureau, April 23, 2025. [Online]. Available: https://www.statista.com/statistics/185206/us-house-sales-with-fha-and-va-insured-mortgages-from-2002/