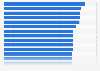
This statistic shows the percent of workers paid hourly rates at or below prevailing federal minimum wage in the United States from 1980 to 2023, by gender. In 2023, only 1.5 percent of the female wage and salary workers were paid hourly rates at or below the federal minimum wage, compared to 21.6 percent in 1980.
Share of workers paid hourly rates at or below prevailing federal minimum wage in the United States from 1980 to 2023, by gender
You have no right to use this feature.
Make sure to contact us if you are interested in scientific citation.
You can upgrade your account to enable this functionality for all statistics.
This feature is not available with your current account.Request access
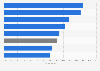
Data for 1990–91, 1996–97, and 2007–09 reflect changes in the minimum wage that took place in those years.
The prevailing Federal minimum wage was $2.90 in 1979, $3.10 in 1980, and $3.35 in 1981–89. The
minimum wage rose to $3.80 in April 1990, to $4.25 in April 1991, to $4.75 in October 1996, to $5.15 in September 1997, to $5.85 in July 2007, to $6.55 in July 2008, and to $7.25 in July 2009.
Learn more about how Statista can support your business.
Bureau of Labor Statistics. (May 29, 2024). Share of workers paid hourly rates at or below prevailing federal minimum wage in the United States from 1980 to 2023, by gender [Graph]. In Statista. Retrieved May 02, 2025, from https://www.statista.com/statistics/185536/share-of-workers-paid-at-the-minimum-wage-by-gender/
Bureau of Labor Statistics. "Share of workers paid hourly rates at or below prevailing federal minimum wage in the United States from 1980 to 2023, by gender." Chart. May 29, 2024. Statista. Accessed May 02, 2025. https://www.statista.com/statistics/185536/share-of-workers-paid-at-the-minimum-wage-by-gender/
Bureau of Labor Statistics. (2024). Share of workers paid hourly rates at or below prevailing federal minimum wage in the United States from 1980 to 2023, by gender. Statista. Statista Inc.. Accessed: May 02, 2025. https://www.statista.com/statistics/185536/share-of-workers-paid-at-the-minimum-wage-by-gender/
Bureau of Labor Statistics. "Share of Workers Paid Hourly Rates at or below Prevailing Federal Minimum Wage in The United States from 1980 to 2023, by Gender." Statista, Statista Inc., 29 May 2024, https://www.statista.com/statistics/185536/share-of-workers-paid-at-the-minimum-wage-by-gender/
Bureau of Labor Statistics, Share of workers paid hourly rates at or below prevailing federal minimum wage in the United States from 1980 to 2023, by gender Statista, https://www.statista.com/statistics/185536/share-of-workers-paid-at-the-minimum-wage-by-gender/ (last visited May 02, 2025)
Share of workers paid hourly rates at or below prevailing federal minimum wage in the United States from 1980 to 2023, by gender [Graph], Bureau of Labor Statistics, May 29, 2024. [Online]. Available: https://www.statista.com/statistics/185536/share-of-workers-paid-at-the-minimum-wage-by-gender/
Profit from additional features with an Employee Account
Please create an employee account to be able to mark statistics as favorites.
Then you can access your favorite statistics via the star in the header.
Profit from the additional features of your individual account
Currently, you are using a shared account. To use individual functions (e.g., mark statistics as favourites, set
statistic alerts) please log in with your personal account.
If you are an admin, please authenticate by logging in again.