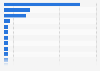
In 2023, in order to create one kilowatt-hour of electricity, nuclear power plants in the United States required 10,452 British thermal units of energy. The operating heat rate for nuclear power in the U.S. has seen only small fluctuations between 2002 to 2023.
Advertisement
Advertisement
Average operating heat rate for nuclear power in the United States from 2002 to 2023
(in British thermal units per kilowatt-hour)
Characteristic
Heat rate in British thermal units per kilowatt-hour
2023
10,452
2022
10,448
2021
10,429
2020
10,446
2019
10,442
2018
10,455
2017
10,459
2016
10,459
2015
10,458
2014
10,459
2013
10,449
2012
10,479
2011
10,464
02,0004,0006,0008,00010,00012,000
Add this content to your personal favorites. These can be accessed from the favorites menu in the main navigation.
You have no right to use this feature.
Make sure to contact us if you are interested in scientific citation.
You can upgrade your account to enable this functionality for all statistics.
This feature is not available with your current account.Request access
Learn more about how Statista can support your business.
EIA. (October 17, 2024). Average operating heat rate for nuclear power in the United States from 2002 to 2023 (in British thermal units per kilowatt-hour) [Graph]. In Statista. Retrieved June 12, 2025, from https://www.statista.com/statistics/186418/average-operating-heat-rate-for-nuclear-power-in-the-us-since-2002/
EIA. "Average operating heat rate for nuclear power in the United States from 2002 to 2023 (in British thermal units per kilowatt-hour)." Chart. October 17, 2024. Statista. Accessed June 12, 2025. https://www.statista.com/statistics/186418/average-operating-heat-rate-for-nuclear-power-in-the-us-since-2002/
EIA. (2024). Average operating heat rate for nuclear power in the United States from 2002 to 2023 (in British thermal units per kilowatt-hour). Statista. Statista Inc.. Accessed: June 12, 2025. https://www.statista.com/statistics/186418/average-operating-heat-rate-for-nuclear-power-in-the-us-since-2002/
EIA. "Average Operating Heat Rate for Nuclear Power in The United States from 2002 to 2023 (in British Thermal Units per Kilowatt-hour)." Statista, Statista Inc., 17 Oct 2024, https://www.statista.com/statistics/186418/average-operating-heat-rate-for-nuclear-power-in-the-us-since-2002/
EIA, Average operating heat rate for nuclear power in the United States from 2002 to 2023 (in British thermal units per kilowatt-hour) Statista, https://www.statista.com/statistics/186418/average-operating-heat-rate-for-nuclear-power-in-the-us-since-2002/ (last visited June 12, 2025)
Average operating heat rate for nuclear power in the United States from 2002 to 2023 (in British thermal units per kilowatt-hour) [Graph], EIA, October 17, 2024. [Online]. Available: https://www.statista.com/statistics/186418/average-operating-heat-rate-for-nuclear-power-in-the-us-since-2002/
Advertisement
Profit from additional features with an Employee Account
Please create an employee account to be able to mark statistics as favorites.
Then you can access your favorite statistics via the star in the header.
Profit from the additional features of your individual account
Currently, you are using a shared account. To use individual functions (e.g., mark statistics as favourites, set
statistic alerts) please log in with your personal account.
If you are an admin, please authenticate by logging in again.