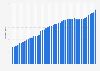
Estimates suggest that in 2026 U.S. adults will spend around 39 percent of their time watching traditional TV each day. This figure has generally fallen in recent years and the downward trend is forecast to continue in the years to come.
Screen time
Although average daily time spent watching TV appears to be decreasing, this does not necessarily mean that people are spending less time in front of screens; this drop is likely due to an increasing amount of time spent with phones, tablets, and laptops. With on-demand streaming services such as Netflix gaining massive popularity, people can watch a huge range of programming whilst on the go, meaning that screen time is no longer limited to time spent at home in front of the TV. Young people around the world have been especially quick to adopt smartphone-based video streaming habits meaning that television screen time will likely fall even further in the future.
Television in the U.S.
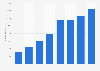
As mentioned above, the way people are consuming their video entertainment content is rapidly changing in the United States. By 2028, estimates suggest that only 40.8 million U.S. households will pay for traditional TV services, down from over 80 million as of 2019. In order to compete for people’s business, cable and satellite providers must find a way to adapt in a way the meets the needs of today’s increasingly mobile consumers. Some are launching their own streaming services in a bid to tackle cord-cutting, most notably Comcast.
Profit from the additional features of your individual account
Currently, you are using a shared account. To use individual functions (e.g., mark statistics as favourites, set
statistic alerts) please log in with your personal account.
If you are an admin, please authenticate by logging in again.
Learn more about how Statista can support your business.
eMarketer. (February 27, 2025). Distribution of average daily time spent watching traditional TV and digital video in the United States from 2020 to 2026 [Graph]. In Statista. Retrieved June 17, 2025, from https://www.statista.com/statistics/186833/average-television-use-per-person-in-the-us-since-2002/
eMarketer. "Distribution of average daily time spent watching traditional TV and digital video in the United States from 2020 to 2026." Chart. February 27, 2025. Statista. Accessed June 17, 2025. https://www.statista.com/statistics/186833/average-television-use-per-person-in-the-us-since-2002/
eMarketer. (2025). Distribution of average daily time spent watching traditional TV and digital video in the United States from 2020 to 2026. Statista. Statista Inc.. Accessed: June 17, 2025. https://www.statista.com/statistics/186833/average-television-use-per-person-in-the-us-since-2002/
eMarketer. "Distribution of Average Daily Time Spent Watching Traditional Tv and Digital Video in The United States from 2020 to 2026." Statista, Statista Inc., 27 Feb 2025, https://www.statista.com/statistics/186833/average-television-use-per-person-in-the-us-since-2002/
eMarketer, Distribution of average daily time spent watching traditional TV and digital video in the United States from 2020 to 2026 Statista, https://www.statista.com/statistics/186833/average-television-use-per-person-in-the-us-since-2002/ (last visited June 17, 2025)
Distribution of average daily time spent watching traditional TV and digital video in the United States from 2020 to 2026 [Graph], eMarketer, February 27, 2025. [Online]. Available: https://www.statista.com/statistics/186833/average-television-use-per-person-in-the-us-since-2002/