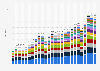
This graph shows the growth in the U.S. import volume of trade goods from Brazil from 1985 to 2023. In 2023, U.S. imports from Brazil amounted to approximately 39.12 billion U.S. dollars.
Advertisement
Advertisement
Volume of U.S. imports of trade goods from Brazil from 1985 to 2023
(in billion U.S. dollars)
Characteristic
Import volume in billion U.S. dollars
2023
39.12
2022
38.91
2021
31.24
2020
23.36
2019
30.93
2018
31.2
2017
29.46
2016
26.04
2015
27.47
2014
30.02
2013
27.54
2012
32.12
2011
31.74
2010
23.96
2009
20.07
2008
30.45
2007
25.64
2006
26.37
2005
24.44
2004
21.16
2003
17.91
2002
15.78
2001
14.47
2000
13.85
1999
11.31
1998
10.1
1997
9.63
1996
8.77
1995
8.83
1994
8.68
1993
7.48
1992
7.61
1991
6.72
1990
7.9
1989
8.41
1988
9.29
1987
7.87
1986
6.81
1985
7.53
Zoomable Statistic: Select the range in the chart you want to zoom in on.
Goods are Merchandise, supplies, raw materials, and products or any other item identified by a Harmonized System (HS) code.
Date of release is date of access.
Profit from the additional features of your individual account
Currently, you are using a shared account. To use individual functions (e.g., mark statistics as favourites, set
statistic alerts) please log in with your personal account.
If you are an admin, please authenticate by logging in again.
Learn more about how Statista can support your business.
US Census Bureau, & US Department of Commerce. (February 22, 2024). Volume of U.S. imports of trade goods from Brazil from 1985 to 2023 (in billion U.S. dollars) [Graph]. In Statista. Retrieved July 15, 2025, from https://www.statista.com/statistics/187671/volume-of-us-imports-of-trade-goods-from-brazil-since-1985/
US Census Bureau, und US Department of Commerce. "Volume of U.S. imports of trade goods from Brazil from 1985 to 2023 (in billion U.S. dollars)." Chart. February 22, 2024. Statista. Accessed July 15, 2025. https://www.statista.com/statistics/187671/volume-of-us-imports-of-trade-goods-from-brazil-since-1985/
US Census Bureau, US Department of Commerce. (2024). Volume of U.S. imports of trade goods from Brazil from 1985 to 2023 (in billion U.S. dollars). Statista. Statista Inc.. Accessed: July 15, 2025. https://www.statista.com/statistics/187671/volume-of-us-imports-of-trade-goods-from-brazil-since-1985/
US Census Bureau, and US Department of Commerce. "Volume of U.S. Imports of Trade Goods from Brazil from 1985 to 2023 (in Billion U.S. Dollars)." Statista, Statista Inc., 22 Feb 2024, https://www.statista.com/statistics/187671/volume-of-us-imports-of-trade-goods-from-brazil-since-1985/
US Census Bureau & US Department of Commerce, Volume of U.S. imports of trade goods from Brazil from 1985 to 2023 (in billion U.S. dollars) Statista, https://www.statista.com/statistics/187671/volume-of-us-imports-of-trade-goods-from-brazil-since-1985/ (last visited July 15, 2025)
Volume of U.S. imports of trade goods from Brazil from 1985 to 2023 (in billion U.S. dollars) [Graph], US Census Bureau, & US Department of Commerce, February 22, 2024. [Online]. Available: https://www.statista.com/statistics/187671/volume-of-us-imports-of-trade-goods-from-brazil-since-1985/