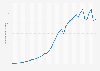
This graph shows the growth in the U.S. import volume of trade goods from all countries from 1987 to 2024. In 2024, U.S. imports from the rest of the world amounted to approximately 3.27 trillion U.S. dollars.
Volume of U.S. imports of trade goods from all countries from 1987 to 2024
(in billion U.S. dollars)
Characteristic
Import Volume in billion U.S. dollars
2024
3,267.39
2023
3,084.09
2022
3,242.53
2021
2,828.87
2020
2,331.48
2019
2,491.7
2018
2,536.15
2017
2,339.59
2016
2,186.79
2015
2,248.81
2014
2,356.36
2013
2,267.99
2012
2,276.27
Zoomable Statistic: Select the range in the chart you want to zoom in on.
05001,0001,5002,0002,5003,0003,5004,000
Add this content to your personal favorites. These can be accessed from the favorites menu in the main navigation.
You have no right to use this feature.
Make sure to contact us if you are interested in scientific citation.
You can upgrade your account to enable this functionality for all statistics.
This feature is not available with your current account.Request access
Goods are Merchandise, supplies, raw materials, and products or any other item identified by a Harmonized System (HS) code.
Seasonal adjustment is a statistical method for removing the seasonal component of a time series used when analyzing non-seasonal trends. Whereas, not-seasonally-adjusted reflects the actual current data. It is normal to report not-seasonally-adjusted data for current unemployment rates. Seasonally adjusted data may be used for the longer term comparison.
Learn more about how Statista can support your business.
US Census Bureau, & US Department of Commerce. (April 3, 2025). Volume of U.S. imports of trade goods from all countries from 1987 to 2024 (in billion U.S. dollars) [Graph]. In Statista. Retrieved May 09, 2025, from https://www.statista.com/statistics/187724/volume-of-us-imports-of-trade-goods-since-1987/
US Census Bureau, und US Department of Commerce. "Volume of U.S. imports of trade goods from all countries from 1987 to 2024 (in billion U.S. dollars)." Chart. April 3, 2025. Statista. Accessed May 09, 2025. https://www.statista.com/statistics/187724/volume-of-us-imports-of-trade-goods-since-1987/
US Census Bureau, US Department of Commerce. (2025). Volume of U.S. imports of trade goods from all countries from 1987 to 2024 (in billion U.S. dollars). Statista. Statista Inc.. Accessed: May 09, 2025. https://www.statista.com/statistics/187724/volume-of-us-imports-of-trade-goods-since-1987/
US Census Bureau, and US Department of Commerce. "Volume of U.S. Imports of Trade Goods from All Countries from 1987 to 2024 (in Billion U.S. Dollars)." Statista, Statista Inc., 3 Apr 2025, https://www.statista.com/statistics/187724/volume-of-us-imports-of-trade-goods-since-1987/
US Census Bureau & US Department of Commerce, Volume of U.S. imports of trade goods from all countries from 1987 to 2024 (in billion U.S. dollars) Statista, https://www.statista.com/statistics/187724/volume-of-us-imports-of-trade-goods-since-1987/ (last visited May 09, 2025)
Volume of U.S. imports of trade goods from all countries from 1987 to 2024 (in billion U.S. dollars) [Graph], US Census Bureau, & US Department of Commerce, April 3, 2025. [Online]. Available: https://www.statista.com/statistics/187724/volume-of-us-imports-of-trade-goods-since-1987/
Profit from additional features with an Employee Account
Please create an employee account to be able to mark statistics as favorites.
Then you can access your favorite statistics via the star in the header.
Profit from the additional features of your individual account
Currently, you are using a shared account. To use individual functions (e.g., mark statistics as favourites, set
statistic alerts) please log in with your personal account.
If you are an admin, please authenticate by logging in again.