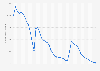
In 2023, 1.1 percent of workers in the United States were paid hourly rates at or below the official minimum wage. This is a decrease from the previous year, when 1.3 percent of workers were paid at or below the official minimum wage.
Advertisement
Advertisement
Share of wage and salary workers in the United States paid hourly rates at or below the prevailing federal minimum wage from 1979 to 2023
The prevailing Federal minimum wage was $2.90 in 1979, $3.10 in 1980, and $3.35 in 1981–89. The minimum wage rose to $3.80 in April 1990, to $4.25 in April 1991, to $4.75 in October 1996, to $5.15 in September 1997, to $5.85 in July 2007, to $6.55 in July 2008, and to $7.25 in July 2009.
Profit from the additional features of your individual account
Currently, you are using a shared account. To use individual functions (e.g., mark statistics as favourites, set
statistic alerts) please log in with your personal account.
If you are an admin, please authenticate by logging in again.
Learn more about how Statista can support your business.
Bureau of Labor Statistics. (August 15, 2024). Share of wage and salary workers in the United States paid hourly rates at or below the prevailing federal minimum wage from 1979 to 2023 [Graph]. In Statista. Retrieved June 27, 2025, from https://www.statista.com/statistics/188206/share-of-workers-paid-hourly-rates-at-or-below-minimum-wage-since-1979/
Bureau of Labor Statistics. "Share of wage and salary workers in the United States paid hourly rates at or below the prevailing federal minimum wage from 1979 to 2023." Chart. August 15, 2024. Statista. Accessed June 27, 2025. https://www.statista.com/statistics/188206/share-of-workers-paid-hourly-rates-at-or-below-minimum-wage-since-1979/
Bureau of Labor Statistics. (2024). Share of wage and salary workers in the United States paid hourly rates at or below the prevailing federal minimum wage from 1979 to 2023. Statista. Statista Inc.. Accessed: June 27, 2025. https://www.statista.com/statistics/188206/share-of-workers-paid-hourly-rates-at-or-below-minimum-wage-since-1979/
Bureau of Labor Statistics. "Share of Wage and Salary Workers in The United States Paid Hourly Rates at or below The Prevailing Federal Minimum Wage from 1979 to 2023." Statista, Statista Inc., 15 Aug 2024, https://www.statista.com/statistics/188206/share-of-workers-paid-hourly-rates-at-or-below-minimum-wage-since-1979/
Bureau of Labor Statistics, Share of wage and salary workers in the United States paid hourly rates at or below the prevailing federal minimum wage from 1979 to 2023 Statista, https://www.statista.com/statistics/188206/share-of-workers-paid-hourly-rates-at-or-below-minimum-wage-since-1979/ (last visited June 27, 2025)
Share of wage and salary workers in the United States paid hourly rates at or below the prevailing federal minimum wage from 1979 to 2023 [Graph], Bureau of Labor Statistics, August 15, 2024. [Online]. Available: https://www.statista.com/statistics/188206/share-of-workers-paid-hourly-rates-at-or-below-minimum-wage-since-1979/