In 2023, the U.S. investments made in the United Kingdom were valued at approximately 1.06 trillion U.S. dollars. The total direct position of the United States abroad amounted to 6.68 trillion U.S. dollars in that year.
Advertisement
Advertisement
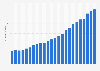
Foreign direct investment position of the United States in the United Kingdom from 2000 to 2023
(in billion U.S. dollars, on a historical-cost basis)
Characteristic
Direct investments in billion U.S. dollars
2023
1,057.59
2022
1,069.24
2021
1,022.83
2020
944.91
2019
852.54
2018
754.14
2017
815.06
2016
747.43
2015
632.33
2014
631.67
2013
537.71
2012
537.04
2011
485.03
02004006008001,0001,200
Add this content to your personal favorites. These can be accessed from the favorites menu in the main navigation.
You have no right to use this feature.
Make sure to contact us if you are interested in scientific citation.
You can upgrade your account to enable this functionality for all statistics.
This feature is not available with your current account.Request access
In accounting, historical cost is the original monetary value of an economic item. Historical cost is based on the stable measuring unit assumption. In some circumstances, assets and liabilities may be shown at their historical cost, as if there had been no change in value since the date of acquisition.
U.S. direct investment abroad is defined as ownership by a U.S. investor of at least 10 percent of a foreign business. The direct investor is known as a U.S. parent, and the U.S.-owned foreign business is known as a foreign affiliate. International transactions statistics cover the foreign affiliates’ transactions with their U.S. parents, so these statistics focus on the U.S. parent’s share, or interest, in its affiliates rather than on the affiliates’ overall size or level of operations. The major items include capital flows, which measure the funds that U.S. parents provide to their foreign affiliates, and income, which measures the return on those funds. Direct investment position statistics are stocks and are cumulative; they measure the total outstanding level of U.S. direct investment abroad at year end.
Learn more about how Statista can support your business.
BEA. (August 1, 2024). Foreign direct investment position of the United States in the United Kingdom from 2000 to 2023 (in billion U.S. dollars, on a historical-cost basis) [Graph]. In Statista. Retrieved July 05, 2025, from https://www.statista.com/statistics/188612/united-states-direct-investments-in-the-united-kingdom-since-2000/
BEA. "Foreign direct investment position of the United States in the United Kingdom from 2000 to 2023 (in billion U.S. dollars, on a historical-cost basis)." Chart. August 1, 2024. Statista. Accessed July 05, 2025. https://www.statista.com/statistics/188612/united-states-direct-investments-in-the-united-kingdom-since-2000/
BEA. (2024). Foreign direct investment position of the United States in the United Kingdom from 2000 to 2023 (in billion U.S. dollars, on a historical-cost basis). Statista. Statista Inc.. Accessed: July 05, 2025. https://www.statista.com/statistics/188612/united-states-direct-investments-in-the-united-kingdom-since-2000/
BEA. "Foreign Direct Investment Position of The United States in The United Kingdom from 2000 to 2023 (in Billion U.S. Dollars, on a Historical-cost Basis)." Statista, Statista Inc., 1 Aug 2024, https://www.statista.com/statistics/188612/united-states-direct-investments-in-the-united-kingdom-since-2000/
BEA, Foreign direct investment position of the United States in the United Kingdom from 2000 to 2023 (in billion U.S. dollars, on a historical-cost basis) Statista, https://www.statista.com/statistics/188612/united-states-direct-investments-in-the-united-kingdom-since-2000/ (last visited July 05, 2025)
Foreign direct investment position of the United States in the United Kingdom from 2000 to 2023 (in billion U.S. dollars, on a historical-cost basis) [Graph], BEA, August 1, 2024. [Online]. Available: https://www.statista.com/statistics/188612/united-states-direct-investments-in-the-united-kingdom-since-2000/
Advertisement
Profit from additional features with an Employee Account
Please create an employee account to be able to mark statistics as favorites.
Then you can access your favorite statistics via the star in the header.
Profit from the additional features of your individual account
Currently, you are using a shared account. To use individual functions (e.g., mark statistics as favourites, set
statistic alerts) please log in with your personal account.
If you are an admin, please authenticate by logging in again.