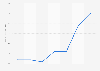
This statistic represents the ratio of unfilled orders to shipments for the fabricated metal industry in the United States between 2000 and 2018. In 2018, the unfilled orders-to-shipments ratio for fabricated metals was around 2.6.
Advertisement
Advertisement
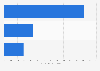
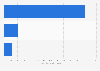
Ratio of unfilled orders to shipments for fabricated metals in the U.S. from 2000 to 2018
Characteristic
Unfilled orders-to-shipment ratio
2018
2.61
2017
2.6
2016
2.67
2008
2.93
2000
2.13
00.511.522.533.5
Add this content to your personal favorites. These can be accessed from the favorites menu in the main navigation.
You have no right to use this feature.
Make sure to contact us if you are interested in scientific citation.
You can upgrade your account to enable this functionality for all statistics.
This feature is not available with your current account.Request access
Learn more about how Statista can support your business.
ProQuest. (December 5, 2019). Ratio of unfilled orders to shipments for fabricated metals in the U.S. from 2000 to 2018 [Graph]. In Statista. Retrieved July 04, 2025, from https://www.statista.com/statistics/188898/unfilled-orders-of-us-fabricated-metals-manufacturers-since-2000/
ProQuest. "Ratio of unfilled orders to shipments for fabricated metals in the U.S. from 2000 to 2018." Chart. December 5, 2019. Statista. Accessed July 04, 2025. https://www.statista.com/statistics/188898/unfilled-orders-of-us-fabricated-metals-manufacturers-since-2000/
ProQuest. (2019). Ratio of unfilled orders to shipments for fabricated metals in the U.S. from 2000 to 2018. Statista. Statista Inc.. Accessed: July 04, 2025. https://www.statista.com/statistics/188898/unfilled-orders-of-us-fabricated-metals-manufacturers-since-2000/
ProQuest. "Ratio of Unfilled Orders to Shipments for Fabricated Metals in The U.S. from 2000 to 2018." Statista, Statista Inc., 5 Dec 2019, https://www.statista.com/statistics/188898/unfilled-orders-of-us-fabricated-metals-manufacturers-since-2000/
ProQuest, Ratio of unfilled orders to shipments for fabricated metals in the U.S. from 2000 to 2018 Statista, https://www.statista.com/statistics/188898/unfilled-orders-of-us-fabricated-metals-manufacturers-since-2000/ (last visited July 04, 2025)
Ratio of unfilled orders to shipments for fabricated metals in the U.S. from 2000 to 2018 [Graph], ProQuest, December 5, 2019. [Online]. Available: https://www.statista.com/statistics/188898/unfilled-orders-of-us-fabricated-metals-manufacturers-since-2000/
Advertisement
Profit from additional features with an Employee Account
Please create an employee account to be able to mark statistics as favorites.
Then you can access your favorite statistics via the star in the header.
Profit from the additional features of your individual account
Currently, you are using a shared account. To use individual functions (e.g., mark statistics as favourites, set
statistic alerts) please log in with your personal account.
If you are an admin, please authenticate by logging in again.