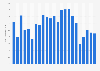
In 2023, the average hours per day spent socializing and communicating by the U.S. population was 0.57 hours. Women spent an average of 0.6 hours per day communicating and socializing, whereas men spent 0.55 hours doing the same everyday.
Average hours per day spent on socializing and communicating by the U.S. population from 2009 to 2023
(in hours per day)
Characteristic
All
Men
Women
2023
0.57
0.55
0.6
2022
0.56
0.51
0.61
2021
0.57
0.52
0.61
2020
0.54
0.52
0.56
2019
0.66
0.59
0.73
2018
0.64
0.59
0.69
2017
0.65
0.6
0.7
2016
0.65
0.64
0.67
2015
0.68
0.64
0.72
2014
0.71
0.69
0.73
2013
0.72
0.65
0.78
2012
0.74
0.72
0.76
2011
0.7
0.63
0.77
00.20.40.60.81
Add this content to your personal favorites. These can be accessed from the favorites menu in the main navigation.
You have no right to use this feature.
Make sure to contact us if you are interested in scientific citation.
You can upgrade your account to enable this functionality for all statistics.
This feature is not available with your current account.Request access
Learn more about how Statista can support your business.
Bureau of Labor Statistics. (June 27, 2024). Average hours per day spent on socializing and communicating by the U.S. population from 2009 to 2023 (in hours per day) [Graph]. In Statista. Retrieved June 04, 2025, from https://www.statista.com/statistics/189527/daily-time-spent-on-socializing-and-communicating-in-the-us-since-2009/
Bureau of Labor Statistics. "Average hours per day spent on socializing and communicating by the U.S. population from 2009 to 2023 (in hours per day)." Chart. June 27, 2024. Statista. Accessed June 04, 2025. https://www.statista.com/statistics/189527/daily-time-spent-on-socializing-and-communicating-in-the-us-since-2009/
Bureau of Labor Statistics. (2024). Average hours per day spent on socializing and communicating by the U.S. population from 2009 to 2023 (in hours per day). Statista. Statista Inc.. Accessed: June 04, 2025. https://www.statista.com/statistics/189527/daily-time-spent-on-socializing-and-communicating-in-the-us-since-2009/
Bureau of Labor Statistics. "Average Hours per Day Spent on Socializing and Communicating by The U.S. Population from 2009 to 2023 (in Hours per Day)." Statista, Statista Inc., 27 Jun 2024, https://www.statista.com/statistics/189527/daily-time-spent-on-socializing-and-communicating-in-the-us-since-2009/
Bureau of Labor Statistics, Average hours per day spent on socializing and communicating by the U.S. population from 2009 to 2023 (in hours per day) Statista, https://www.statista.com/statistics/189527/daily-time-spent-on-socializing-and-communicating-in-the-us-since-2009/ (last visited June 04, 2025)
Average hours per day spent on socializing and communicating by the U.S. population from 2009 to 2023 (in hours per day) [Graph], Bureau of Labor Statistics, June 27, 2024. [Online]. Available: https://www.statista.com/statistics/189527/daily-time-spent-on-socializing-and-communicating-in-the-us-since-2009/
Profit from additional features with an Employee Account
Please create an employee account to be able to mark statistics as favorites.
Then you can access your favorite statistics via the star in the header.
Profit from the additional features of your individual account
Currently, you are using a shared account. To use individual functions (e.g., mark statistics as favourites, set
statistic alerts) please log in with your personal account.
If you are an admin, please authenticate by logging in again.