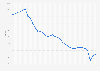
There were over 7.55 million arrests for all offenses in the United States in 2023. This figure is a decrease from 1990 levels, when the number of arrests was over 14.1 million.
Arrest rate in the U.S.
Along with the declining number of arrests, the arrest rate for all offenses in the United States has also decreased since 1990, from 5691.6 arrests per 100,000 of the population down to 2232.1 per 100,000 in 2023. Additionally, South Dakota had the highest arrest rate in the country in 2023 while Massachusetts had the lowest.
High numbers of arrests and unsolved crimes
A high number of arrests does not necessarily correlate to a high number of solved cases, and in the U.S., many cases remain unsolved. The crime clearance rate, or rate of closed cases, was less than half for violent crimes in the U.S., and less than 20 percent for property crimes.
Advertisement
Advertisement
Number of arrests for all offenses in the United States from 1990 to 2023
The number of arrests presented differ from other published numbers because of weighting. The weighting procedure calculates the proportion of all arrests attributable to an age group and multiplies this percentage by the total estimated number of arrests to determine an estimated count.
Due to the FBI's transition to a new crime reporting system in 2021, not all law enforcement agencies submitted data to the FBI. As a result, figures may not accurately reflect the total number of arrests in 2021, 2022, and 2023.
Profit from the additional features of your individual account
Currently, you are using a shared account. To use individual functions (e.g., mark statistics as favourites, set
statistic alerts) please log in with your personal account.
If you are an admin, please authenticate by logging in again.
Learn more about how Statista can support your business.
FBI. (September 23, 2024). Number of arrests for all offenses in the United States from 1990 to 2023 [Graph]. In Statista. Retrieved June 28, 2025, from https://www.statista.com/statistics/191261/number-of-arrests-for-all-offenses-in-the-us-since-1990/
FBI. "Number of arrests for all offenses in the United States from 1990 to 2023." Chart. September 23, 2024. Statista. Accessed June 28, 2025. https://www.statista.com/statistics/191261/number-of-arrests-for-all-offenses-in-the-us-since-1990/
FBI. (2024). Number of arrests for all offenses in the United States from 1990 to 2023. Statista. Statista Inc.. Accessed: June 28, 2025. https://www.statista.com/statistics/191261/number-of-arrests-for-all-offenses-in-the-us-since-1990/
FBI. "Number of Arrests for All Offenses in The United States from 1990 to 2023." Statista, Statista Inc., 23 Sep 2024, https://www.statista.com/statistics/191261/number-of-arrests-for-all-offenses-in-the-us-since-1990/
FBI, Number of arrests for all offenses in the United States from 1990 to 2023 Statista, https://www.statista.com/statistics/191261/number-of-arrests-for-all-offenses-in-the-us-since-1990/ (last visited June 28, 2025)
Number of arrests for all offenses in the United States from 1990 to 2023 [Graph], FBI, September 23, 2024. [Online]. Available: https://www.statista.com/statistics/191261/number-of-arrests-for-all-offenses-in-the-us-since-1990/