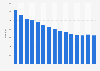
This statistic shows the total civilian consumption of butter (as food product) in the United States from 1999 to 2023. In 2023, total butter consumption in the U.S. came to about 2.2 billion pounds.
Advertisement
Advertisement
Total consumption of butter in the U.S. from 1999 to 2023 (in million pounds)*
Characteristic
Consumption in million pounds
2023
2,182
2022
2,004
2021
2,141
2020
2,098
2019
2,026
2018
1,901
2017
1,856
2016
1,847
2015
1,800
2014
1,753
2013
1,731
2012
1,730
2011
1,676
05001,0001,5002,0002,500
Add this content to your personal favorites. These can be accessed from the favorites menu in the main navigation.
You have no right to use this feature.
Make sure to contact us if you are interested in scientific citation.
You can upgrade your account to enable this functionality for all statistics.
This feature is not available with your current account.Request access
* Total disappearance is based on production, imports, and change in stocks during the year. Production statistics for these commodities appear in other tables in this chapter. The total apparent consumption was obtained by subtracting ending stocks, shipments, and exports, from the total supply. The per capita consumption for each year was obtained by dividing the total apparent consumption by the number of persons.
Learn more about how Statista can support your business.
US Department of Agriculture, & Economic Research Service. (February 14, 2024). Total consumption of butter in the U.S. from 1999 to 2023 (in million pounds)* [Graph]. In Statista. Retrieved June 14, 2025, from https://www.statista.com/statistics/192624/consumption-of-butter-in-the-us-since-1999/
US Department of Agriculture, und Economic Research Service. "Total consumption of butter in the U.S. from 1999 to 2023 (in million pounds)*." Chart. February 14, 2024. Statista. Accessed June 14, 2025. https://www.statista.com/statistics/192624/consumption-of-butter-in-the-us-since-1999/
US Department of Agriculture, Economic Research Service. (2024). Total consumption of butter in the U.S. from 1999 to 2023 (in million pounds)*. Statista. Statista Inc.. Accessed: June 14, 2025. https://www.statista.com/statistics/192624/consumption-of-butter-in-the-us-since-1999/
US Department of Agriculture, and Economic Research Service. "Total Consumption of Butter in The U.S. from 1999 to 2023 (in Million Pounds)*." Statista, Statista Inc., 14 Feb 2024, https://www.statista.com/statistics/192624/consumption-of-butter-in-the-us-since-1999/
US Department of Agriculture & Economic Research Service, Total consumption of butter in the U.S. from 1999 to 2023 (in million pounds)* Statista, https://www.statista.com/statistics/192624/consumption-of-butter-in-the-us-since-1999/ (last visited June 14, 2025)
Total consumption of butter in the U.S. from 1999 to 2023 (in million pounds)* [Graph], US Department of Agriculture, & Economic Research Service, February 14, 2024. [Online]. Available: https://www.statista.com/statistics/192624/consumption-of-butter-in-the-us-since-1999/
Advertisement
Profit from additional features with an Employee Account
Please create an employee account to be able to mark statistics as favorites.
Then you can access your favorite statistics via the star in the header.
Profit from the additional features of your individual account
Currently, you are using a shared account. To use individual functions (e.g., mark statistics as favourites, set
statistic alerts) please log in with your personal account.
If you are an admin, please authenticate by logging in again.