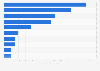
The statistic shows U.S. sales of soap via different sales channels in 2011/2012. In that year, U.S. sales of soap via drug outlets amounted to 549.5 million U.S. dollars. Total U.S. soap sales were 2.11 billion U.S. dollars in 2011/2012.
U.S. sales of soap via different sales channels in 2011/2012
(in million U.S. dollars)
Profit from the additional features of your individual account
Currently, you are using a shared account. To use individual functions (e.g., mark statistics as favourites, set
statistic alerts) please log in with your personal account.
If you are an admin, please authenticate by logging in again.
Learn more about how Statista can support your business.
Grocery Headquarters. (October 1, 2011). U.S. sales of soap via different sales channels in 2011/2012 (in million U.S. dollars) [Graph]. In Statista. Retrieved June 08, 2025, from https://www.statista.com/statistics/192657/us-soap-sales-via-different-sales-channels-in-2010-and-2011/
Grocery Headquarters. "U.S. sales of soap via different sales channels in 2011/2012 (in million U.S. dollars)." Chart. October 1, 2011. Statista. Accessed June 08, 2025. https://www.statista.com/statistics/192657/us-soap-sales-via-different-sales-channels-in-2010-and-2011/
Grocery Headquarters. (2011). U.S. sales of soap via different sales channels in 2011/2012 (in million U.S. dollars). Statista. Statista Inc.. Accessed: June 08, 2025. https://www.statista.com/statistics/192657/us-soap-sales-via-different-sales-channels-in-2010-and-2011/
Grocery Headquarters. "U.S. Sales of Soap via Different Sales Channels in 2011/2012 (in Million U.S. Dollars)." Statista, Statista Inc., 1 Oct 2011, https://www.statista.com/statistics/192657/us-soap-sales-via-different-sales-channels-in-2010-and-2011/
Grocery Headquarters, U.S. sales of soap via different sales channels in 2011/2012 (in million U.S. dollars) Statista, https://www.statista.com/statistics/192657/us-soap-sales-via-different-sales-channels-in-2010-and-2011/ (last visited June 08, 2025)
U.S. sales of soap via different sales channels in 2011/2012 (in million U.S. dollars) [Graph], Grocery Headquarters, October 1, 2011. [Online]. Available: https://www.statista.com/statistics/192657/us-soap-sales-via-different-sales-channels-in-2010-and-2011/