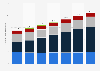
The statistic shows U.S. sales of batteries via different sales channels in 2010/2011. In that period, U.S. sales of batteries via drug outlets amounted to 604.7 million U.S. dollars. Total U.S. battery sales were 1.51 billion U.S. dollars in 2010/2011.
U.S. sales of batteries via different sales channels in 2010/2011
(in million U.S. dollars)
Sales channel
Million U.S. dollars
Other outlets (excluding Walmart)
343.9
Food outlets
559.2
Drug outlets
604.7
Total
1,507.8
02505007501,0001,2501,5001,750
Add this content to your personal favorites. These can be accessed from the favorites menu in the main navigation.
You have no right to use this feature.
Make sure to contact us if you are interested in scientific citation.
You can upgrade your account to enable this functionality for all statistics.
This feature is not available with your current account.Request access
Learn more about how Statista can support your business.
Grocery Headquarters. (October 1, 2010). U.S. sales of batteries via different sales channels in 2010/2011 (in million U.S. dollars) [Graph]. In Statista. Retrieved June 10, 2025, from https://www.statista.com/statistics/193112/us-battery-sales-via-different-sales-channels-in-2009-and-2010/
Grocery Headquarters. "U.S. sales of batteries via different sales channels in 2010/2011 (in million U.S. dollars)." Chart. October 1, 2010. Statista. Accessed June 10, 2025. https://www.statista.com/statistics/193112/us-battery-sales-via-different-sales-channels-in-2009-and-2010/
Grocery Headquarters. (2010). U.S. sales of batteries via different sales channels in 2010/2011 (in million U.S. dollars). Statista. Statista Inc.. Accessed: June 10, 2025. https://www.statista.com/statistics/193112/us-battery-sales-via-different-sales-channels-in-2009-and-2010/
Grocery Headquarters. "U.S. Sales of Batteries via Different Sales Channels in 2010/2011 (in Million U.S. Dollars)." Statista, Statista Inc., 1 Oct 2010, https://www.statista.com/statistics/193112/us-battery-sales-via-different-sales-channels-in-2009-and-2010/
Grocery Headquarters, U.S. sales of batteries via different sales channels in 2010/2011 (in million U.S. dollars) Statista, https://www.statista.com/statistics/193112/us-battery-sales-via-different-sales-channels-in-2009-and-2010/ (last visited June 10, 2025)
U.S. sales of batteries via different sales channels in 2010/2011 (in million U.S. dollars) [Graph], Grocery Headquarters, October 1, 2010. [Online]. Available: https://www.statista.com/statistics/193112/us-battery-sales-via-different-sales-channels-in-2009-and-2010/
Profit from additional features with an Employee Account
Please create an employee account to be able to mark statistics as favorites.
Then you can access your favorite statistics via the star in the header.
Profit from the additional features of your individual account
Currently, you are using a shared account. To use individual functions (e.g., mark statistics as favourites, set
statistic alerts) please log in with your personal account.
If you are an admin, please authenticate by logging in again.