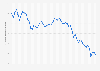
Per capita carbon dioxide emissions in the United States were estimated at 14 metric tons (tCO₂) in 2024. Under a business-as-usual scenario based on laws and regulations as of December 2024 under evolutionary technological growth assumptions, U.S. per capita emissions would fall to 9.2 tCO₂ by 2050. Since 1990, U.S. per capita emissions have reduced by roughly 30 percent.
Americans have a large carbon footprint
Although per capita emissions have fallen in the U.S., they are still far higher than other countries. This is especially the case when compared to other major GHG emitters like China and India. In 2023, per capita GHG emissions in the U.S. were 17.2 tCO₂e, roughly 2.5 times the global average.
Which state has the largest carbon footprint?
The U.S. state with the largest carbon footprint is Wyoming. In 2022, energy-related per capita CO₂ emissions in Wyoming were 96.6 tCO₂, roughly six times the national average. This is because of the states polluting coal industry.
Advertisement
Advertisement
U.S. carbon dioxide emissions per capita from 2024 to 2050
(in metric tons of carbon dioxide equivalent)
Characteristic
Emissions in metric tons of CO₂ equivalent/ person
2050
9.2
2049
9.2
2048
9.2
2047
9.2
2046
9.2
2045
9.3
2044
9.3
2043
9.3
2042
9.4
2041
9.5
2040
9.5
2039
9.6
2038
9.8
2037
10
2036
10.3
2035
10.5
2034
10.8
2033
11.1
2032
11.4
2031
12.1
2030
12.4
2029
12.7
2028
13
2027
13.1
2026
13.4
2025
13.9
2024
14
Zoomable Statistic: Select the range in the chart you want to zoom in on.
The projections under the AEO2024 Reference case are based on a business-as-usual trend estimate, given known technology and technological and demographic trends, as well as current laws and regulations as of December 2024.
Profit from the additional features of your individual account
Currently, you are using a shared account. To use individual functions (e.g., mark statistics as favourites, set
statistic alerts) please log in with your personal account.
If you are an admin, please authenticate by logging in again.
Learn more about how Statista can support your business.
EIA. (April 15, 2025). U.S. carbon dioxide emissions per capita from 2024 to 2050 (in metric tons of carbon dioxide equivalent) [Graph]. In Statista. Retrieved June 28, 2025, from https://www.statista.com/statistics/193174/us-carbon-dioxide-emissions-per-person-since-2009/
EIA. "U.S. carbon dioxide emissions per capita from 2024 to 2050 (in metric tons of carbon dioxide equivalent)." Chart. April 15, 2025. Statista. Accessed June 28, 2025. https://www.statista.com/statistics/193174/us-carbon-dioxide-emissions-per-person-since-2009/
EIA. (2025). U.S. carbon dioxide emissions per capita from 2024 to 2050 (in metric tons of carbon dioxide equivalent). Statista. Statista Inc.. Accessed: June 28, 2025. https://www.statista.com/statistics/193174/us-carbon-dioxide-emissions-per-person-since-2009/
EIA. "U.S. Carbon Dioxide Emissions per Capita from 2024 to 2050 (in Metric Tons of Carbon Dioxide Equivalent)." Statista, Statista Inc., 15 Apr 2025, https://www.statista.com/statistics/193174/us-carbon-dioxide-emissions-per-person-since-2009/
EIA, U.S. carbon dioxide emissions per capita from 2024 to 2050 (in metric tons of carbon dioxide equivalent) Statista, https://www.statista.com/statistics/193174/us-carbon-dioxide-emissions-per-person-since-2009/ (last visited June 28, 2025)
U.S. carbon dioxide emissions per capita from 2024 to 2050 (in metric tons of carbon dioxide equivalent) [Graph], EIA, April 15, 2025. [Online]. Available: https://www.statista.com/statistics/193174/us-carbon-dioxide-emissions-per-person-since-2009/