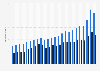
This statistic shows the gross operating surplus of U.S. chemical products manufacturing from 1998 to 2016. In 2016, the gross operating surplus of this sector in the United States came to approximately 271 billion U.S. dollars.
Gross operating surplus of chemical products manufacturing in the United States from 1998 to 2016
(in billion U.S. dollars)
Characteristic
Gross operating surplus in billion U.S. dollars
2016
271.1
2015
261.5
2014
255
2013
247.3
2012
236.9
2011
235.6
2010
233
2009
214.4
2008
183
2007
184.44
2006
173.3
2005
141.08
2004
146.93
020406080100120140160180200220240260280300
Add this content to your personal favorites. These can be accessed from the favorites menu in the main navigation.
You have no right to use this feature.
Make sure to contact us if you are interested in scientific citation.
You can upgrade your account to enable this functionality for all statistics.
This feature is not available with your current account.Request access
Learn more about how Statista can support your business.
BEA. (November 2, 2017). Gross operating surplus of chemical products manufacturing in the United States from 1998 to 2016 (in billion U.S. dollars) [Graph]. In Statista. Retrieved May 09, 2025, from https://www.statista.com/statistics/193810/gross-operating-surplus-of-us-chemical-manufacturing-since-1998/
BEA. "Gross operating surplus of chemical products manufacturing in the United States from 1998 to 2016 (in billion U.S. dollars)." Chart. November 2, 2017. Statista. Accessed May 09, 2025. https://www.statista.com/statistics/193810/gross-operating-surplus-of-us-chemical-manufacturing-since-1998/
BEA. (2017). Gross operating surplus of chemical products manufacturing in the United States from 1998 to 2016 (in billion U.S. dollars). Statista. Statista Inc.. Accessed: May 09, 2025. https://www.statista.com/statistics/193810/gross-operating-surplus-of-us-chemical-manufacturing-since-1998/
BEA. "Gross Operating Surplus of Chemical Products Manufacturing in The United States from 1998 to 2016 (in Billion U.S. Dollars)." Statista, Statista Inc., 2 Nov 2017, https://www.statista.com/statistics/193810/gross-operating-surplus-of-us-chemical-manufacturing-since-1998/
BEA, Gross operating surplus of chemical products manufacturing in the United States from 1998 to 2016 (in billion U.S. dollars) Statista, https://www.statista.com/statistics/193810/gross-operating-surplus-of-us-chemical-manufacturing-since-1998/ (last visited May 09, 2025)
Gross operating surplus of chemical products manufacturing in the United States from 1998 to 2016 (in billion U.S. dollars) [Graph], BEA, November 2, 2017. [Online]. Available: https://www.statista.com/statistics/193810/gross-operating-surplus-of-us-chemical-manufacturing-since-1998/
Profit from additional features with an Employee Account
Please create an employee account to be able to mark statistics as favorites.
Then you can access your favorite statistics via the star in the header.
Profit from the additional features of your individual account
Currently, you are using a shared account. To use individual functions (e.g., mark statistics as favourites, set
statistic alerts) please log in with your personal account.
If you are an admin, please authenticate by logging in again.