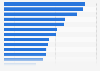
In the fiscal year 2025 (ending March 2025), video game company Take-Two Entertainment generated 60.4 percent of its revenue in the United States, translating to almost 3.4 billion U.S. dollars during the measured period. The U.S. has accounted for the majority of TTE's revenue since 2015.
Advertisement
Advertisement
Distribution of revenue of Take-Two Interactive from fiscal year 2010 to 2025, by region
* Take-Two Interactive's fiscal year starts on April 1 and ends on March 31 of the following year. Fiscal year 2013 started on April 1, 2012 and ended on March 31, 2013. Data older than 2025 comes from previous reports.
Profit from the additional features of your individual account
Currently, you are using a shared account. To use individual functions (e.g., mark statistics as favourites, set
statistic alerts) please log in with your personal account.
If you are an admin, please authenticate by logging in again.
Learn more about how Statista can support your business.
Take-Two Interactive. (May 15, 2025). Distribution of revenue of Take-Two Interactive from fiscal year 2010 to 2025, by region [Graph]. In Statista. Retrieved June 12, 2025, from https://www.statista.com/statistics/194465/revenue-breakdown-of-take-two-interactive-by-region/
Take-Two Interactive. "Distribution of revenue of Take-Two Interactive from fiscal year 2010 to 2025, by region." Chart. May 15, 2025. Statista. Accessed June 12, 2025. https://www.statista.com/statistics/194465/revenue-breakdown-of-take-two-interactive-by-region/
Take-Two Interactive. (2025). Distribution of revenue of Take-Two Interactive from fiscal year 2010 to 2025, by region. Statista. Statista Inc.. Accessed: June 12, 2025. https://www.statista.com/statistics/194465/revenue-breakdown-of-take-two-interactive-by-region/
Take-Two Interactive. "Distribution of Revenue of Take-two Interactive from Fiscal Year 2010 to 2025, by Region." Statista, Statista Inc., 15 May 2025, https://www.statista.com/statistics/194465/revenue-breakdown-of-take-two-interactive-by-region/
Take-Two Interactive, Distribution of revenue of Take-Two Interactive from fiscal year 2010 to 2025, by region Statista, https://www.statista.com/statistics/194465/revenue-breakdown-of-take-two-interactive-by-region/ (last visited June 12, 2025)
Distribution of revenue of Take-Two Interactive from fiscal year 2010 to 2025, by region [Graph], Take-Two Interactive, May 15, 2025. [Online]. Available: https://www.statista.com/statistics/194465/revenue-breakdown-of-take-two-interactive-by-region/