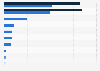
This statistic shows the voting rates in the United States in 2012, by state. In 2012, 66.3 percent of the citizens in Louisiana voted in the presidential elections.
Advertisement
Advertisement
Voting rate in the presidential elections in the United States in 2012, by state
You have no right to use this feature.
Make sure to contact us if you are interested in scientific citation.
You can upgrade your account to enable this functionality for all statistics.
This feature is not available with your current account.Request access
Learn more about how Statista can support your business.
US Census Bureau. (May 8, 2013). Voting rate in the presidential elections in the United States in 2012, by state [Graph]. In Statista. Retrieved June 27, 2025, from https://www.statista.com/statistics/195869/voting-rate-in-the-presidential-elections-in-the-us-in-2008-by-state/
US Census Bureau. "Voting rate in the presidential elections in the United States in 2012, by state." Chart. May 8, 2013. Statista. Accessed June 27, 2025. https://www.statista.com/statistics/195869/voting-rate-in-the-presidential-elections-in-the-us-in-2008-by-state/
US Census Bureau. (2013). Voting rate in the presidential elections in the United States in 2012, by state. Statista. Statista Inc.. Accessed: June 27, 2025. https://www.statista.com/statistics/195869/voting-rate-in-the-presidential-elections-in-the-us-in-2008-by-state/
US Census Bureau. "Voting Rate in The Presidential Elections in The United States in 2012, by State." Statista, Statista Inc., 8 May 2013, https://www.statista.com/statistics/195869/voting-rate-in-the-presidential-elections-in-the-us-in-2008-by-state/
US Census Bureau, Voting rate in the presidential elections in the United States in 2012, by state Statista, https://www.statista.com/statistics/195869/voting-rate-in-the-presidential-elections-in-the-us-in-2008-by-state/ (last visited June 27, 2025)
Voting rate in the presidential elections in the United States in 2012, by state [Graph], US Census Bureau, May 8, 2013. [Online]. Available: https://www.statista.com/statistics/195869/voting-rate-in-the-presidential-elections-in-the-us-in-2008-by-state/
Advertisement
Profit from additional features with an Employee Account
Please create an employee account to be able to mark statistics as favorites.
Then you can access your favorite statistics via the star in the header.
Profit from the additional features of your individual account
Currently, you are using a shared account. To use individual functions (e.g., mark statistics as favourites, set
statistic alerts) please log in with your personal account.
If you are an admin, please authenticate by logging in again.