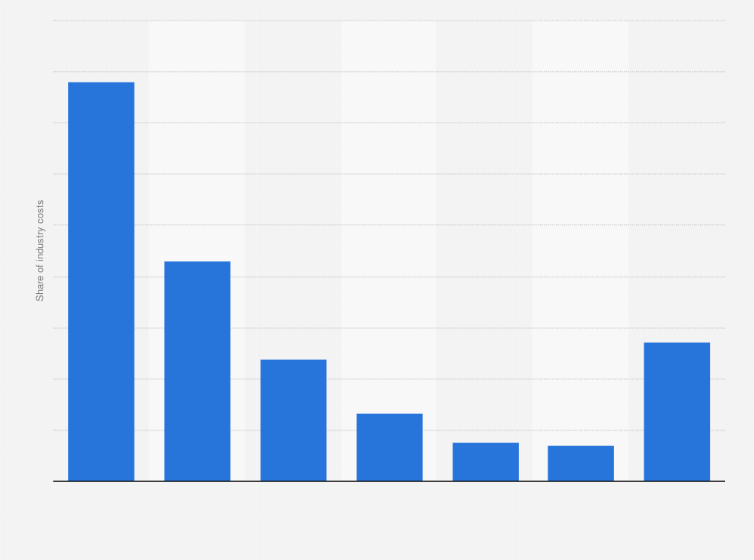
This graph depicts the percentage distribution of industry costs of the coffee and snack shops industry in the U.S. in 2015. In that year, wages accounted for 21.5 percent of coffee and snack show industry costs.
Advertisement
Advertisement
Distribution of coffee and snack shop industry expenditures in the United States in 2015, by cost type*
Adjust the presentation of the statistic and data points.
Share the statistic on social media channels or embed the statistic in your
website using "Embed Code", where available.
Cite this statistic and select one of the following formats: APA, Chicago, Harvard, MLA & Bluebook.
Print the statistic including description and metadata.
Chart type
Distribution of coffee and snack shop industry expenditures in the United States in 2015, by cost type*
Share this statistic
You have no right to use this feature.
Make sure to contact us if you are interested in scientific citation.
You can upgrade your account to enable this functionality for all statistics.
This feature is not available with your current account.Request access
* The coffee and snack shop industry is comprised of establishments that sell speciality snacks and nonalcoholic beverages, including ice cream, frozen yogurt, cookies, donuts, bagels, coffee, juices, smoothies, or sodas.
The data represents the latest cost structure of the industry. It shows the proportion of revenue each cost item absorbs, with the remainder representing profit.
Learn more about how Statista can support your business.
IBISWorld. (April 15, 2015). Distribution of coffee and snack shop industry expenditures in the United States in 2015, by cost type* [Graph]. In Statista. Retrieved July 06, 2025, from https://www.statista.com/statistics/196551/revenue-by-cost-factor-of-us-coffee-and-snack-shops-industry/
IBISWorld. "Distribution of coffee and snack shop industry expenditures in the United States in 2015, by cost type*." Chart. April 15, 2015. Statista. Accessed July 06, 2025. https://www.statista.com/statistics/196551/revenue-by-cost-factor-of-us-coffee-and-snack-shops-industry/
IBISWorld. (2015). Distribution of coffee and snack shop industry expenditures in the United States in 2015, by cost type*. Statista. Statista Inc.. Accessed: July 06, 2025. https://www.statista.com/statistics/196551/revenue-by-cost-factor-of-us-coffee-and-snack-shops-industry/
IBISWorld. "Distribution of Coffee and Snack Shop Industry Expenditures in The United States in 2015, by Cost Type*." Statista, Statista Inc., 15 Apr 2015, https://www.statista.com/statistics/196551/revenue-by-cost-factor-of-us-coffee-and-snack-shops-industry/
IBISWorld, Distribution of coffee and snack shop industry expenditures in the United States in 2015, by cost type* Statista, https://www.statista.com/statistics/196551/revenue-by-cost-factor-of-us-coffee-and-snack-shops-industry/ (last visited July 06, 2025)
Distribution of coffee and snack shop industry expenditures in the United States in 2015, by cost type* [Graph], IBISWorld, April 15, 2015. [Online]. Available: https://www.statista.com/statistics/196551/revenue-by-cost-factor-of-us-coffee-and-snack-shops-industry/
Advertisement
Profit from additional features with an Employee Account
Please create an employee account to be able to mark statistics as favorites.
Then you can access your favorite statistics via the star in the header.
Profit from the additional features of your individual account
Currently, you are using a shared account. To use individual functions (e.g., mark statistics as favourites, set
statistic alerts) please log in with your personal account.
If you are an admin, please authenticate by logging in again.