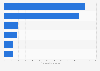
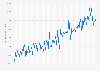
This timeline depicts pharmacy and drug store sales in the United States from 1992 to 2022. In 2022, U.S. pharmacy and drug store sales amounted to about 336 billion U.S. dollars.
U.S. Pharmacies and Drug Stores Industry
The retail drug industry is comprised of pharmacies or drugstores, as they are known in North America. With an aging population and greater prevalence of chronic diseases, the need for safe, legal pharmaceutical drugs is constantly rising.
Pharmacies and drug stores dispense prescription medications and over-the-counter drugs directly to patients. However, their role is more than one of simple distribution as they dispense medication in specific doses, adhere to optimal conditions of storage and give valuable advice to patients. Pharmacies practice in a wide range of locations such as communities, hospitals, clinics and nursing homes. Other drug retail outlets include supermarkets, and independent and online pharmacies, which offer mail-order drugs to patients, proving especially convenient for those that may be unable to leave their homes. Apart from selling drugs, miscellaneous products also account for a percentage of sales for these retail outlets, such as cosmetics and confectioneries.
The retail drug store industry employs many different types of workers. Each store has a manager, along with department managers or assistant managers to handle additional administrative duties. Sales associates are generally entry-level retail workers. Pharmacists require a specialized degree and licensing to dispense medication.
Advertisement
Advertisement
Pharmacy and drug store sales in the United States from 1992 to 2022
(in billion U.S. dollars)
Year
Billion U.S. dollars
2022
336.3
2021
322.98
2020
302.44
2019
288.3
2018
279.52
2017
269.05
2016
262.95
2015
255.64
2014
245.53
2013
233.09
2012
229.95
2011
231.25
2010
222.23
2009
217.26
2008
210.86
2007
202.28
2006
191.02
2005
179.17
2004
169.23
2003
165.52
2002
153.94
2001
141.77
2000
130.86
1999
121.28
1998
108.42
1997
98.82
1996
91.81
1995
85.84
1994
81.99
1993
79.71
1992
77.79
Zoomable Statistic: Select the range in the chart you want to zoom in on.
Numbers have been rounded to provide a better understanding of the statistic.
Figures are not adjusted for price changes. Retail and food services total and other subsector totals may include data for kinds of business not shown. Additional information on sample design, estimation procedures, and measures of sampling variabilty can be found here.
Estimates are shown in millions of dollars and are based on data from the Annual Retail Trade Survey. Estimates have been adjusted using preliminary results of the 2017 Economic Census.
Profit from the additional features of your individual account
Currently, you are using a shared account. To use individual functions (e.g., mark statistics as favourites, set
statistic alerts) please log in with your personal account.
If you are an admin, please authenticate by logging in again.
Learn more about how Statista can support your business.
US Census Bureau. (January 29, 2024). Pharmacy and drug store sales in the United States from 1992 to 2022 (in billion U.S. dollars) [Graph]. In Statista. Retrieved July 02, 2025, from https://www.statista.com/statistics/197635/annual-pharmacies-and-drug-store-sales-in-the-us-since-1992/
US Census Bureau. "Pharmacy and drug store sales in the United States from 1992 to 2022 (in billion U.S. dollars)." Chart. January 29, 2024. Statista. Accessed July 02, 2025. https://www.statista.com/statistics/197635/annual-pharmacies-and-drug-store-sales-in-the-us-since-1992/
US Census Bureau. (2024). Pharmacy and drug store sales in the United States from 1992 to 2022 (in billion U.S. dollars). Statista. Statista Inc.. Accessed: July 02, 2025. https://www.statista.com/statistics/197635/annual-pharmacies-and-drug-store-sales-in-the-us-since-1992/
US Census Bureau. "Pharmacy and Drug Store Sales in The United States from 1992 to 2022 (in Billion U.S. Dollars)." Statista, Statista Inc., 29 Jan 2024, https://www.statista.com/statistics/197635/annual-pharmacies-and-drug-store-sales-in-the-us-since-1992/
US Census Bureau, Pharmacy and drug store sales in the United States from 1992 to 2022 (in billion U.S. dollars) Statista, https://www.statista.com/statistics/197635/annual-pharmacies-and-drug-store-sales-in-the-us-since-1992/ (last visited July 02, 2025)
Pharmacy and drug store sales in the United States from 1992 to 2022 (in billion U.S. dollars) [Graph], US Census Bureau, January 29, 2024. [Online]. Available: https://www.statista.com/statistics/197635/annual-pharmacies-and-drug-store-sales-in-the-us-since-1992/