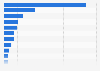
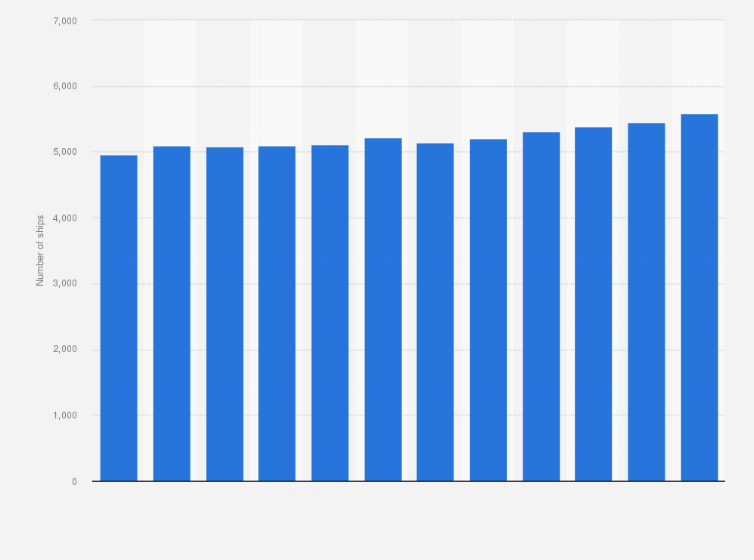
Nearly 5,600 container ships were serving sea routes worldwide in 2022. China, Japan, and South Korea were the world's major shipbuilding nations in 2020.
The global ocean fleet
Over the past decade, the number of container ships in the the global fleet increased from 4,966 ships in 2011 to 5,589 ships in 2022, while the carrying capacity of the global merchant fleet reached roughly two billion deadweight tons in 2020. Based on the chartered twenty-foot equivalent units (TEUs), Mediterranean Shipping Co. is the leading container ship operator worldwide.
The impact of COVID-19 on ports
As of the beginning of March 2020, about 80 blank sailings were announced in global maritime traffic due to the coronavirus (COVID-19) pandemic, with China being the worst-hit region at the beginning. Between the Chinese New Year and mid-March, 108 blank sailings were announced on deep-sea shipping routes due to the pandemic. In Latin America, some ports were negatively affected, while others experienced a year-on-year increase in container traffic in the 1st quarter of 2020.
Number of container ships in the global merchant fleet from 2011 to 2022
Adjust the presentation of the statistic and data points.
Share the statistic on social media channels or embed the statistic in your
website using "Embed Code", where available.
Cite this statistic and select one of the following formats: APA, Chicago, Harvard, MLA & Bluebook.
Print the statistic including description and metadata.
Chart type
Number of container ships in the global merchant fleet from 2011 to 2022
Share this statistic
You have no right to use this feature.
Make sure to contact us if you are interested in scientific citation.
You can upgrade your account to enable this functionality for all statistics.
This feature is not available with your current account.Request access
To retrieve the data, select Maritime transport from the Folders menu, select the "Merchant fleet by flag of registration and by type of ship, annual" table, and from the drop-down menu in the table, select Measure: Number of ships.
Learn more about how Statista can support your business.
UNCTAD. (November 29, 2022). Number of container ships in the global merchant fleet from 2011 to 2022 [Graph]. In Statista. Retrieved June 04, 2025, from https://www.statista.com/statistics/198227/forecast-for-global-number-of-containerships-from-2011/
UNCTAD. "Number of container ships in the global merchant fleet from 2011 to 2022." Chart. November 29, 2022. Statista. Accessed June 04, 2025. https://www.statista.com/statistics/198227/forecast-for-global-number-of-containerships-from-2011/
UNCTAD. (2022). Number of container ships in the global merchant fleet from 2011 to 2022. Statista. Statista Inc.. Accessed: June 04, 2025. https://www.statista.com/statistics/198227/forecast-for-global-number-of-containerships-from-2011/
UNCTAD. "Number of Container Ships in The Global Merchant Fleet from 2011 to 2022." Statista, Statista Inc., 29 Nov 2022, https://www.statista.com/statistics/198227/forecast-for-global-number-of-containerships-from-2011/
UNCTAD, Number of container ships in the global merchant fleet from 2011 to 2022 Statista, https://www.statista.com/statistics/198227/forecast-for-global-number-of-containerships-from-2011/ (last visited June 04, 2025)
Number of container ships in the global merchant fleet from 2011 to 2022 [Graph], UNCTAD, November 29, 2022. [Online]. Available: https://www.statista.com/statistics/198227/forecast-for-global-number-of-containerships-from-2011/
Profit from additional features with an Employee Account
Please create an employee account to be able to mark statistics as favorites.
Then you can access your favorite statistics via the star in the header.
Profit from the additional features of your individual account
Currently, you are using a shared account. To use individual functions (e.g., mark statistics as favourites, set
statistic alerts) please log in with your personal account.
If you are an admin, please authenticate by logging in again.