In fiscal year ended March 2024, Under Armour had license revenues of 111.24 million U.S. dollars. Each year, the majority of the company's revenues are generated through its sales from apparel, footwear, and accessory products.
Advertisement
Advertisement
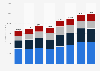
Net revenue of Under Armour worldwide from 2020 to 2024, by type
(in million U.S. dollars)
Characteristic
Net sales (apparel, footwear, accessories)
License revenues
Corporate other
2024
5,578.34
111.24
12.3
2023
5,735.42
116.75
51.47
2022 (transition period)*
5,600.89
117.57
8.76
2021
5,567.27
112.6
3.57
2020
4,230.98
105.78
137.91
01,0002,0003,0004,0005,0006,0007,000
Add this content to your personal favorites. These can be accessed from the favorites menu in the main navigation.
You have no right to use this feature.
Make sure to contact us if you are interested in scientific citation.
You can upgrade your account to enable this functionality for all statistics.
This feature is not available with your current account.Request access
* Financial years up until 2021 began on January 1 and ended December 31. After 2021, Under Armour went through a transitional period and from 2022 on, fiscal years begin April 1 and end March 31 (for instance "Fiscal 2022" refers to the fiscal year beginning on April 1, 2021 and ended March 31, 2022). For this reason, overlaps between the fiscal years of 2021 and 2022 are to be expected.
Learn more about how Statista can support your business.
Under Armour. (May 29, 2024). Net revenue of Under Armour worldwide from 2020 to 2024, by type (in million U.S. dollars) [Graph]. In Statista. Retrieved June 25, 2025, from https://www.statista.com/statistics/201055/under-armour-revenue-by-source/
Under Armour. "Net revenue of Under Armour worldwide from 2020 to 2024, by type (in million U.S. dollars)." Chart. May 29, 2024. Statista. Accessed June 25, 2025. https://www.statista.com/statistics/201055/under-armour-revenue-by-source/
Under Armour. (2024). Net revenue of Under Armour worldwide from 2020 to 2024, by type (in million U.S. dollars). Statista. Statista Inc.. Accessed: June 25, 2025. https://www.statista.com/statistics/201055/under-armour-revenue-by-source/
Under Armour. "Net Revenue of Under Armour Worldwide from 2020 to 2024, by Type (in Million U.S. Dollars)." Statista, Statista Inc., 29 May 2024, https://www.statista.com/statistics/201055/under-armour-revenue-by-source/
Under Armour, Net revenue of Under Armour worldwide from 2020 to 2024, by type (in million U.S. dollars) Statista, https://www.statista.com/statistics/201055/under-armour-revenue-by-source/ (last visited June 25, 2025)
Net revenue of Under Armour worldwide from 2020 to 2024, by type (in million U.S. dollars) [Graph], Under Armour, May 29, 2024. [Online]. Available: https://www.statista.com/statistics/201055/under-armour-revenue-by-source/
Advertisement
Profit from additional features with an Employee Account
Please create an employee account to be able to mark statistics as favorites.
Then you can access your favorite statistics via the star in the header.
Profit from the additional features of your individual account
Currently, you are using a shared account. To use individual functions (e.g., mark statistics as favourites, set
statistic alerts) please log in with your personal account.
If you are an admin, please authenticate by logging in again.