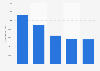
In the United States, the median income in 2023 was at 65,540 U.S. dollars for Hispanic households. This is a large increase from 1990 when the median income was 47,600 U.S. dollars for Hispanic households (in 2023 U.S. dollars).
Advertisement
Advertisement
Median income of Hispanic private households in the United States from 1990 to 2023
(in 2023 U.S. dollars)
Income in 2023 CPI-U-RS adjusted dollars. Hispanic households can be of any race Medians are calculated using 2,500 U.S. dollars income intervals. Beginning with 2009 income data, the Census Bureau expanded the upper income intervals used to calculate medians to 250,000 U.S. dollars or more. Medians falling in the upper open-ended interval are plugged with “$250,000.” Before 2009, the upper open-ended interval was 100,000 U.S. dollars and a plug of “$100,000” was used.
Profit from the additional features of your individual account
Currently, you are using a shared account. To use individual functions (e.g., mark statistics as favourites, set
statistic alerts) please log in with your personal account.
If you are an admin, please authenticate by logging in again.
Learn more about how Statista can support your business.
US Census Bureau. (September 16, 2024). Median income of Hispanic private households in the United States from 1990 to 2023 (in 2023 U.S. dollars) [Graph]. In Statista. Retrieved June 24, 2025, from https://www.statista.com/statistics/203301/median-income-of-hispanic-households-in-the-us/
US Census Bureau. "Median income of Hispanic private households in the United States from 1990 to 2023 (in 2023 U.S. dollars)." Chart. September 16, 2024. Statista. Accessed June 24, 2025. https://www.statista.com/statistics/203301/median-income-of-hispanic-households-in-the-us/
US Census Bureau. (2024). Median income of Hispanic private households in the United States from 1990 to 2023 (in 2023 U.S. dollars). Statista. Statista Inc.. Accessed: June 24, 2025. https://www.statista.com/statistics/203301/median-income-of-hispanic-households-in-the-us/
US Census Bureau. "Median Income of Hispanic Private Households in The United States from 1990 to 2023 (in 2023 U.S. Dollars)." Statista, Statista Inc., 16 Sep 2024, https://www.statista.com/statistics/203301/median-income-of-hispanic-households-in-the-us/
US Census Bureau, Median income of Hispanic private households in the United States from 1990 to 2023 (in 2023 U.S. dollars) Statista, https://www.statista.com/statistics/203301/median-income-of-hispanic-households-in-the-us/ (last visited June 24, 2025)
Median income of Hispanic private households in the United States from 1990 to 2023 (in 2023 U.S. dollars) [Graph], US Census Bureau, September 16, 2024. [Online]. Available: https://www.statista.com/statistics/203301/median-income-of-hispanic-households-in-the-us/