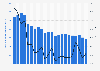
In 2024, the U.S. transportation sector produced about *** billion metric tons of CO₂ from energy consumption. While transportation has emerged as the largest source of CO₂ emissions from energy consumption since 2016, emissions from the electric power sector have experienced a notable decline.
Evolving energy landscape
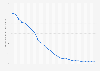
In 2024, the U.S. electric power sector, once the country’s largest source of CO₂ emissions, generated approximately *** billion metric tons of CO₂, a ** percent decrease from its peak emissions in 2007. This decline can be attributed to the country's shift towards cleaner energy sources, such as natural gas and renewables, and the phasing out of coal. This has seen U.S. electricity generation from coal decrease by more than ** percent since 2010.
U.S. contributions to global power emissions
Despite the progress in reducing emissions from its power sector, the U.S. remains the second-largest emitter from electricity generation, globally. In 2023, the North American country was responsible for around ** percent of total global power sector emissions, with only China's power sector emitting more that year.
These figures only include carbon dioxide emissions from fossil fuels. Carbon dioxide emissions from biomass energy consumption are excluded from total emissions in this statistic. According to the source, metric tons of carbon dioxide can be converted to metric tons of carbon equivalent by multiplying by 12/44. Figures are direct emissions and exclude emissions from energy consumption in the electric power sector that are allocated to the end-use sectors in proportion to each sector's share of total electricity sales to ultimate customers.
Profit from the additional features of your individual account
Currently, you are using a shared account. To use individual functions (e.g., mark statistics as favourites, set
statistic alerts) please log in with your personal account.
If you are an admin, please authenticate by logging in again.
Learn more about how Statista can support your business.
EIA. (March 27, 2025). Carbon dioxide emissions from energy consumption in the United States from 1975 to 2024, by sector (in million metric tons of carbon dioxide) [Graph]. In Statista. Retrieved July 06, 2025, from https://www.statista.com/statistics/204879/us-carbon-dioxide-emissions-by-sector-since-1950/
EIA. "Carbon dioxide emissions from energy consumption in the United States from 1975 to 2024, by sector (in million metric tons of carbon dioxide)." Chart. March 27, 2025. Statista. Accessed July 06, 2025. https://www.statista.com/statistics/204879/us-carbon-dioxide-emissions-by-sector-since-1950/
EIA. (2025). Carbon dioxide emissions from energy consumption in the United States from 1975 to 2024, by sector (in million metric tons of carbon dioxide). Statista. Statista Inc.. Accessed: July 06, 2025. https://www.statista.com/statistics/204879/us-carbon-dioxide-emissions-by-sector-since-1950/
EIA. "Carbon Dioxide Emissions from Energy Consumption in The United States from 1975 to 2024, by Sector (in Million Metric Tons of Carbon Dioxide)." Statista, Statista Inc., 27 Mar 2025, https://www.statista.com/statistics/204879/us-carbon-dioxide-emissions-by-sector-since-1950/
EIA, Carbon dioxide emissions from energy consumption in the United States from 1975 to 2024, by sector (in million metric tons of carbon dioxide) Statista, https://www.statista.com/statistics/204879/us-carbon-dioxide-emissions-by-sector-since-1950/ (last visited July 06, 2025)
Carbon dioxide emissions from energy consumption in the United States from 1975 to 2024, by sector (in million metric tons of carbon dioxide) [Graph], EIA, March 27, 2025. [Online]. Available: https://www.statista.com/statistics/204879/us-carbon-dioxide-emissions-by-sector-since-1950/