In 2023, some18 percent of U.S. respondents in grades 8, 10, and 12 istated that they used marijuana/hashish within that year. This statistic shows the annual prevalence of use of marijuana/hashish for grades 8, 10, and 12 combined, from 1991 to 2023.
Advertisement
Advertisement
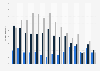
Annual prevalence of use of marijuana/hashish for grades 8, 10, and 12 combined from 1991 to 2023
Characteristic
Percentage of respondents
2023
18%
2022
19.4%
2021
17.9%
2020
24.6%
2019
25.2%
2018
24.3%
2017
23.9%
2016
22.6%
2015
23.7%
2014
24.2%
2013
25.8%
2012
24.7%
2011
25%
0%2%4%6%8%10%12%14%16%18%20%22%24%26%28%30%32%34%
Add this content to your personal favorites. These can be accessed from the favorites menu in the main navigation.
You have no right to use this feature.
Make sure to contact us if you are interested in scientific citation.
You can upgrade your account to enable this functionality for all statistics.
This feature is not available with your current account.Request access
Monitoring the Future is an ongoing study of the behaviors, attitudes, and values of American secondary school students, college students, and young adults. Each year, a total of approximately 50,000 8th, 10th and 12th grade students are surveyed (12th graders since 1975, and 8th and 10th graders since 1991).
Learn more about how Statista can support your business.
NIDA, & NIH. (May 31, 2024). Annual prevalence of use of marijuana/hashish for grades 8, 10, and 12 combined from 1991 to 2023 [Graph]. In Statista. Retrieved June 13, 2025, from https://www.statista.com/statistics/208450/us-annual-prevalence-of-hashish-use-in-grades-8-10-12-since-1991/
NIDA, und NIH. "Annual prevalence of use of marijuana/hashish for grades 8, 10, and 12 combined from 1991 to 2023." Chart. May 31, 2024. Statista. Accessed June 13, 2025. https://www.statista.com/statistics/208450/us-annual-prevalence-of-hashish-use-in-grades-8-10-12-since-1991/
NIDA, NIH. (2024). Annual prevalence of use of marijuana/hashish for grades 8, 10, and 12 combined from 1991 to 2023. Statista. Statista Inc.. Accessed: June 13, 2025. https://www.statista.com/statistics/208450/us-annual-prevalence-of-hashish-use-in-grades-8-10-12-since-1991/
NIDA, and NIH. "Annual Prevalence of Use of Marijuana/Hashish for Grades 8, 10, and 12 Combined from 1991 to 2023." Statista, Statista Inc., 31 May 2024, https://www.statista.com/statistics/208450/us-annual-prevalence-of-hashish-use-in-grades-8-10-12-since-1991/
NIDA & NIH, Annual prevalence of use of marijuana/hashish for grades 8, 10, and 12 combined from 1991 to 2023 Statista, https://www.statista.com/statistics/208450/us-annual-prevalence-of-hashish-use-in-grades-8-10-12-since-1991/ (last visited June 13, 2025)
Annual prevalence of use of marijuana/hashish for grades 8, 10, and 12 combined from 1991 to 2023 [Graph], NIDA, & NIH, May 31, 2024. [Online]. Available: https://www.statista.com/statistics/208450/us-annual-prevalence-of-hashish-use-in-grades-8-10-12-since-1991/
Advertisement
Profit from additional features with an Employee Account
Please create an employee account to be able to mark statistics as favorites.
Then you can access your favorite statistics via the star in the header.
Profit from the additional features of your individual account
Currently, you are using a shared account. To use individual functions (e.g., mark statistics as favourites, set
statistic alerts) please log in with your personal account.
If you are an admin, please authenticate by logging in again.