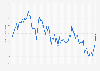
Annual futures contract three price for Cushing Oklahoma crude oil stood at 67.3 U.S. dollars per barrel in 2021, an increase compared to the previous years. During the period in consideration, figures peaked at over 100 U.S. dollars per barrel in 2008.
Advertisement
Advertisement
Average annual crude oil futures contract three prices in the U.S. from 1990 to 2021*
(U.S. dollars per barrel)
Characteristic
Price in U.S. dollars per barrel
2021
67.3
2020
40.88
2019
57.17
2018
64.27
2017
51.41
2016
45.13
2015
50.53
2014
91.81
2013
97.88
2012
94.95
2011
96.29
2010
81.25
2005
57.87
020406080100120
Add this content to your personal favorites. These can be accessed from the favorites menu in the main navigation.
You have no right to use this feature.
Make sure to contact us if you are interested in scientific citation.
You can upgrade your account to enable this functionality for all statistics.
This feature is not available with your current account.Request access
* All prices refer to light sweet oil from Cushing, Oklahoma, traded at the New York Mercantile Exchange, U.S. Contracts 2-4 represent the successive delivery months following Contract 1. Contract 1 is a futures contract specifying the earliest delivery date. For crude oil, each contract expires on the third business day prior to the 25th calendar day of the month preceding the delivery month. If the 25th calendar day of the month is a non-business day, trading ceases on the third business day prior to the business day preceding
the 25th calendar day. After a contract expires, Contract 1 for the remainder of that calendar month is the second following month.
Learn more about how Statista can support your business.
EIA. (November 30, 2022). Average annual crude oil futures contract three prices in the U.S. from 1990 to 2021* (U.S. dollars per barrel) [Graph]. In Statista. Retrieved July 04, 2025, from https://www.statista.com/statistics/209581/average-annual-futures-contract-3-price-of-crude-oil/
EIA. "Average annual crude oil futures contract three prices in the U.S. from 1990 to 2021* (U.S. dollars per barrel)." Chart. November 30, 2022. Statista. Accessed July 04, 2025. https://www.statista.com/statistics/209581/average-annual-futures-contract-3-price-of-crude-oil/
EIA. (2022). Average annual crude oil futures contract three prices in the U.S. from 1990 to 2021* (U.S. dollars per barrel). Statista. Statista Inc.. Accessed: July 04, 2025. https://www.statista.com/statistics/209581/average-annual-futures-contract-3-price-of-crude-oil/
EIA. "Average Annual Crude Oil Futures Contract Three Prices in The U.S. from 1990 to 2021* (U.S. Dollars per Barrel)." Statista, Statista Inc., 30 Nov 2022, https://www.statista.com/statistics/209581/average-annual-futures-contract-3-price-of-crude-oil/
EIA, Average annual crude oil futures contract three prices in the U.S. from 1990 to 2021* (U.S. dollars per barrel) Statista, https://www.statista.com/statistics/209581/average-annual-futures-contract-3-price-of-crude-oil/ (last visited July 04, 2025)
Average annual crude oil futures contract three prices in the U.S. from 1990 to 2021* (U.S. dollars per barrel) [Graph], EIA, November 30, 2022. [Online]. Available: https://www.statista.com/statistics/209581/average-annual-futures-contract-3-price-of-crude-oil/
Advertisement
Profit from additional features with an Employee Account
Please create an employee account to be able to mark statistics as favorites.
Then you can access your favorite statistics via the star in the header.
Profit from the additional features of your individual account
Currently, you are using a shared account. To use individual functions (e.g., mark statistics as favourites, set
statistic alerts) please log in with your personal account.
If you are an admin, please authenticate by logging in again.