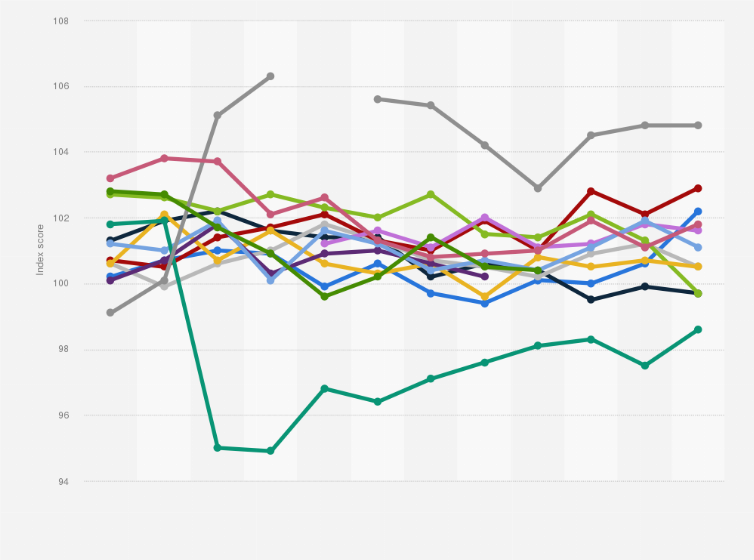
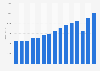
Restaurant industry performance index in the U.S. 2011-2023, by month
In September 2023, the U.S. restaurant industry received a performance index score of 100.4. One year prior, the industry received an index score of 101. The restaurant industry performance index is a statistical barometer measuring the overall health of the U.S. restaurant industry. The index is based on the results of the monthly Restaurant Industry Tracking Survey composed of a variety of indicators including sales, traffic, labor and capital expenditures. A value above 100 indicates a period of expansion while a value below 100 indicates a period of contraction.