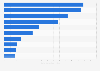
The graph gives an overview of weekly video content consumption behavior of members of Trailing Millennials (age group 18 to 24) in the United States from the first to the fourth quarter of 2016, sorted by platform. In the fourth quarter of 2016, Trailing Millennial adults spent 37 minutes a week using a DVD/Blu Ray device. Despite DVDs being less used for video content consumption, DVD sales data shows that consumers turn to the medium if only to have their favorite movie in their private collection.
Advertisement
Advertisement
Weekly time spent with video content among Trailing Millennials in the United States from 1st quarter 2016 to 4th quarter 2016, by platform
(in minutes)
Adjust the presentation of the statistic and data points.
Share the statistic on social media channels or embed the statistic in your
website using "Embed Code", where available.
Cite this statistic and select one of the following formats: APA, Chicago, Harvard, MLA & Bluebook.
Print the statistic including description and metadata.
Chart type
Weekly time spent with video content among Trailing Millennials in the United States from 1st quarter 2016 to 4th quarter 2016, by platform
Share this statistic
You have no right to use this feature.
Make sure to contact us if you are interested in scientific citation.
You can upgrade your account to enable this functionality for all statistics.
This feature is not available with your current account.Request access
Learn more about how Statista can support your business.
Nielsen. (April 3, 2017). Weekly time spent with video content among Trailing Millennials in the United States from 1st quarter 2016 to 4th quarter 2016, by platform (in minutes) [Graph]. In Statista. Retrieved June 15, 2025, from https://www.statista.com/statistics/215165/weekly-video-consumption-of-americans-broken-down-by-platform/
Nielsen. "Weekly time spent with video content among Trailing Millennials in the United States from 1st quarter 2016 to 4th quarter 2016, by platform (in minutes)." Chart. April 3, 2017. Statista. Accessed June 15, 2025. https://www.statista.com/statistics/215165/weekly-video-consumption-of-americans-broken-down-by-platform/
Nielsen. (2017). Weekly time spent with video content among Trailing Millennials in the United States from 1st quarter 2016 to 4th quarter 2016, by platform (in minutes). Statista. Statista Inc.. Accessed: June 15, 2025. https://www.statista.com/statistics/215165/weekly-video-consumption-of-americans-broken-down-by-platform/
Nielsen. "Weekly Time Spent with Video Content among Trailing Millennials in The United States from 1st Quarter 2016 to 4th Quarter 2016, by Platform (in Minutes)." Statista, Statista Inc., 3 Apr 2017, https://www.statista.com/statistics/215165/weekly-video-consumption-of-americans-broken-down-by-platform/
Nielsen, Weekly time spent with video content among Trailing Millennials in the United States from 1st quarter 2016 to 4th quarter 2016, by platform (in minutes) Statista, https://www.statista.com/statistics/215165/weekly-video-consumption-of-americans-broken-down-by-platform/ (last visited June 15, 2025)
Weekly time spent with video content among Trailing Millennials in the United States from 1st quarter 2016 to 4th quarter 2016, by platform (in minutes) [Graph], Nielsen, April 3, 2017. [Online]. Available: https://www.statista.com/statistics/215165/weekly-video-consumption-of-americans-broken-down-by-platform/
Advertisement
Profit from additional features with an Employee Account
Please create an employee account to be able to mark statistics as favorites.
Then you can access your favorite statistics via the star in the header.
Profit from the additional features of your individual account
Currently, you are using a shared account. To use individual functions (e.g., mark statistics as favourites, set
statistic alerts) please log in with your personal account.
If you are an admin, please authenticate by logging in again.