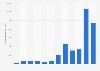
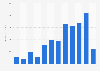
This graph shows the weekly spending on TV ads for the presidential campaign by the Republican candidates and president Obama up until November 6, 2012. During the week ending October 27, Barack Obama spent about 24 million U.S. dollars on political ads, while Romney only spent 13 million U.S. dollars.
Advertisement
Advertisement
Weekly spending on TV ads for the presidential campaign by all candidates up to election day 2012
You have no right to use this feature.
Make sure to contact us if you are interested in scientific citation.
You can upgrade your account to enable this functionality for all statistics.
This feature is not available with your current account.Request access
Learn more about how Statista can support your business.
Washington Post. (November 14, 2012). Weekly spending on TV ads for the presidential campaign by all candidates up to election day 2012 [Graph]. In Statista. Retrieved July 14, 2025, from https://www.statista.com/statistics/215403/weekly-spendings-on-tv-ads-of-the-republican-predidential-candidates/
Washington Post. "Weekly spending on TV ads for the presidential campaign by all candidates up to election day 2012." Chart. November 14, 2012. Statista. Accessed July 14, 2025. https://www.statista.com/statistics/215403/weekly-spendings-on-tv-ads-of-the-republican-predidential-candidates/
Washington Post. (2012). Weekly spending on TV ads for the presidential campaign by all candidates up to election day 2012. Statista. Statista Inc.. Accessed: July 14, 2025. https://www.statista.com/statistics/215403/weekly-spendings-on-tv-ads-of-the-republican-predidential-candidates/
Washington Post. "Weekly Spending on Tv Ads for The Presidential Campaign by All Candidates up to Election Day 2012." Statista, Statista Inc., 14 Nov 2012, https://www.statista.com/statistics/215403/weekly-spendings-on-tv-ads-of-the-republican-predidential-candidates/
Washington Post, Weekly spending on TV ads for the presidential campaign by all candidates up to election day 2012 Statista, https://www.statista.com/statistics/215403/weekly-spendings-on-tv-ads-of-the-republican-predidential-candidates/ (last visited July 14, 2025)
Weekly spending on TV ads for the presidential campaign by all candidates up to election day 2012 [Graph], Washington Post, November 14, 2012. [Online]. Available: https://www.statista.com/statistics/215403/weekly-spendings-on-tv-ads-of-the-republican-predidential-candidates/
Advertisement
Profit from additional features with an Employee Account
Please create an employee account to be able to mark statistics as favorites.
Then you can access your favorite statistics via the star in the header.
Profit from the additional features of your individual account
Currently, you are using a shared account. To use individual functions (e.g., mark statistics as favourites, set
statistic alerts) please log in with your personal account.
If you are an admin, please authenticate by logging in again.