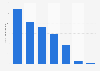
The statistic depicts the share of households with pay TV only worldwide from the first quarter of 2017 to the third quarter of 2018. According to the source, 21 percent of TV households worldwide only received pay TV in the third quarter of 2018.
Share of pay TV only households worldwide from 1st quarter 2017 to 3rd quarter 2018
Characteristic
Share of TV households
Q3 2018
21%
Q1 2018
24%
Q3 2017
30%
Q1 2017
32%
0%5%10%15%20%25%30%35%40%
Add this content to your personal favorites. These can be accessed from the favorites menu in the main navigation.
You have no right to use this feature.
Make sure to contact us if you are interested in scientific citation.
You can upgrade your account to enable this functionality for all statistics.
This feature is not available with your current account.Request access
Learn more about how Statista can support your business.
Ampere Analysis. (October 24, 2018). Share of pay TV only households worldwide from 1st quarter 2017 to 3rd quarter 2018 [Graph]. In Statista. Retrieved May 10, 2025, from https://www.statista.com/statistics/215497/proportion-of-households-with-pay-tv-worldwide-since-2005/
Ampere Analysis. "Share of pay TV only households worldwide from 1st quarter 2017 to 3rd quarter 2018." Chart. October 24, 2018. Statista. Accessed May 10, 2025. https://www.statista.com/statistics/215497/proportion-of-households-with-pay-tv-worldwide-since-2005/
Ampere Analysis. (2018). Share of pay TV only households worldwide from 1st quarter 2017 to 3rd quarter 2018. Statista. Statista Inc.. Accessed: May 10, 2025. https://www.statista.com/statistics/215497/proportion-of-households-with-pay-tv-worldwide-since-2005/
Ampere Analysis. "Share of Pay Tv Only Households Worldwide from 1st Quarter 2017 to 3rd Quarter 2018." Statista, Statista Inc., 24 Oct 2018, https://www.statista.com/statistics/215497/proportion-of-households-with-pay-tv-worldwide-since-2005/
Ampere Analysis, Share of pay TV only households worldwide from 1st quarter 2017 to 3rd quarter 2018 Statista, https://www.statista.com/statistics/215497/proportion-of-households-with-pay-tv-worldwide-since-2005/ (last visited May 10, 2025)
Share of pay TV only households worldwide from 1st quarter 2017 to 3rd quarter 2018 [Graph], Ampere Analysis, October 24, 2018. [Online]. Available: https://www.statista.com/statistics/215497/proportion-of-households-with-pay-tv-worldwide-since-2005/
Profit from additional features with an Employee Account
Please create an employee account to be able to mark statistics as favorites.
Then you can access your favorite statistics via the star in the header.
Profit from the additional features of your individual account
Currently, you are using a shared account. To use individual functions (e.g., mark statistics as favourites, set
statistic alerts) please log in with your personal account.
If you are an admin, please authenticate by logging in again.