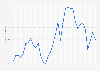
In 2023, the overall Export Price Index for the United States was at 120.95. This is a slight decrease from the year previous, when the Index stood at 122.86. This index consists of export prices for goods and services. The U.S. Export Price Index measures average changes in prices of goods and services that are exported from the United States.
Advertisement
Advertisement
Annual Export Price Index in the United States from 1990 to 2023
Profit from the additional features of your individual account
Currently, you are using a shared account. To use individual functions (e.g., mark statistics as favourites, set
statistic alerts) please log in with your personal account.
If you are an admin, please authenticate by logging in again.
Learn more about how Statista can support your business.
BEA. (January 7, 2025). Annual Export Price Index in the United States from 1990 to 2023 [Graph]. In Statista. Retrieved June 14, 2025, from https://www.statista.com/statistics/216586/annual-export-price-index-in-the-us/
BEA. "Annual Export Price Index in the United States from 1990 to 2023." Chart. January 7, 2025. Statista. Accessed June 14, 2025. https://www.statista.com/statistics/216586/annual-export-price-index-in-the-us/
BEA. (2025). Annual Export Price Index in the United States from 1990 to 2023. Statista. Statista Inc.. Accessed: June 14, 2025. https://www.statista.com/statistics/216586/annual-export-price-index-in-the-us/
BEA. "Annual Export Price Index in The United States from 1990 to 2023." Statista, Statista Inc., 7 Jan 2025, https://www.statista.com/statistics/216586/annual-export-price-index-in-the-us/
BEA, Annual Export Price Index in the United States from 1990 to 2023 Statista, https://www.statista.com/statistics/216586/annual-export-price-index-in-the-us/ (last visited June 14, 2025)
Annual Export Price Index in the United States from 1990 to 2023 [Graph], BEA, January 7, 2025. [Online]. Available: https://www.statista.com/statistics/216586/annual-export-price-index-in-the-us/