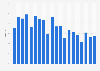
This statistic represents the supply and consumption of gasoline in Northeastern United States from 2007 to 2011 with projections through 2013. In 2013, the Northeastern region is expected to consume around 1.5 million barrels of gasoline per day, while supply figures are estimated to stagnate at around 1.3 million barrels daily due to the closure of Sunoco's refinery in Philadelphia.
* Data through November 2011. ** These figures represent an outlook. According to the source, projected consumption is based on EIA analysis. Projected production is based on assumed yields and the capacity of remaining refineries.
Figures have been rounded to closest 10,000 billion barrels per day.
Profit from the additional features of your individual account
Currently, you are using a shared account. To use individual functions (e.g., mark statistics as favourites, set
statistic alerts) please log in with your personal account.
If you are an admin, please authenticate by logging in again.
Learn more about how Statista can support your business.
EIA. (February 22, 2012). Supply and consumption of gasoline in Northeastern United States from 2007 to 2011 with projections through 2013 (in 1,000 barrels per day) [Graph]. In Statista. Retrieved June 26, 2025, from https://www.statista.com/statistics/220405/supply-and-consumption-of-gasoline-in-northeastern-united-states/
EIA. "Supply and consumption of gasoline in Northeastern United States from 2007 to 2011 with projections through 2013 (in 1,000 barrels per day)." Chart. February 22, 2012. Statista. Accessed June 26, 2025. https://www.statista.com/statistics/220405/supply-and-consumption-of-gasoline-in-northeastern-united-states/
EIA. (2012). Supply and consumption of gasoline in Northeastern United States from 2007 to 2011 with projections through 2013 (in 1,000 barrels per day). Statista. Statista Inc.. Accessed: June 26, 2025. https://www.statista.com/statistics/220405/supply-and-consumption-of-gasoline-in-northeastern-united-states/
EIA. "Supply and Consumption of Gasoline in Northeastern United States from 2007 to 2011 with Projections through 2013 (in 1,000 Barrels per Day)." Statista, Statista Inc., 22 Feb 2012, https://www.statista.com/statistics/220405/supply-and-consumption-of-gasoline-in-northeastern-united-states/
EIA, Supply and consumption of gasoline in Northeastern United States from 2007 to 2011 with projections through 2013 (in 1,000 barrels per day) Statista, https://www.statista.com/statistics/220405/supply-and-consumption-of-gasoline-in-northeastern-united-states/ (last visited June 26, 2025)
Supply and consumption of gasoline in Northeastern United States from 2007 to 2011 with projections through 2013 (in 1,000 barrels per day) [Graph], EIA, February 22, 2012. [Online]. Available: https://www.statista.com/statistics/220405/supply-and-consumption-of-gasoline-in-northeastern-united-states/