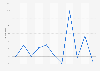
The retail trade revenue of gold, silver, and jewelry in China totaled approximately ***** billion yuan in June 2025. This indicated an increase compared to the same period of the previous year.
*According to the source, figures for January and February have been grouped together to curb the influence of the Chinese New Year on the statistics. Chinese New Year falls between January and February.
One yuan equals approximately 0.14 U.S. dollars and 0.12 euros (as of July 2025).
According to the source, retail sales refer to the trade revenue of tangible goods not intended for business use traded from wholesale and retail companies to individuals or non producing social organizations. Figures include total revenues of the food and beverage service industry. During the survey, only wholesale companies with an annual revenue of 20 million yuan and above as well as retail companies with an annual revenue of five million yuan were questioned.
The source did not provide a date of publication. The date used here is the access date.
Profit from the additional features of your individual account
Currently, you are using a shared account. To use individual functions (e.g., mark statistics as favourites, set
statistic alerts) please log in with your personal account.
If you are an admin, please authenticate by logging in again.
Learn more about how Statista can support your business.
National Bureau of Statistics of China. (July 24, 2025). Retail trade revenue of gold, silver, and jewelry in China from June 2024 to June 2025 (in billion yuan) [Graph]. In Statista. Retrieved July 24, 2025, from https://www.statista.com/statistics/226672/trade-revenue-of-jewelry-in-china-by-month/
National Bureau of Statistics of China. "Retail trade revenue of gold, silver, and jewelry in China from June 2024 to June 2025 (in billion yuan)." Chart. July 24, 2025. Statista. Accessed July 24, 2025. https://www.statista.com/statistics/226672/trade-revenue-of-jewelry-in-china-by-month/
National Bureau of Statistics of China. (2025). Retail trade revenue of gold, silver, and jewelry in China from June 2024 to June 2025 (in billion yuan). Statista. Statista Inc.. Accessed: July 24, 2025. https://www.statista.com/statistics/226672/trade-revenue-of-jewelry-in-china-by-month/
National Bureau of Statistics of China. "Retail Trade Revenue of Gold, Silver, and Jewelry in China from June 2024 to June 2025 (in Billion Yuan)." Statista, Statista Inc., 24 Jul 2025, https://www.statista.com/statistics/226672/trade-revenue-of-jewelry-in-china-by-month/
National Bureau of Statistics of China, Retail trade revenue of gold, silver, and jewelry in China from June 2024 to June 2025 (in billion yuan) Statista, https://www.statista.com/statistics/226672/trade-revenue-of-jewelry-in-china-by-month/ (last visited July 24, 2025)
Retail trade revenue of gold, silver, and jewelry in China from June 2024 to June 2025 (in billion yuan) [Graph], National Bureau of Statistics of China, July 24, 2025. [Online]. Available: https://www.statista.com/statistics/226672/trade-revenue-of-jewelry-in-china-by-month/